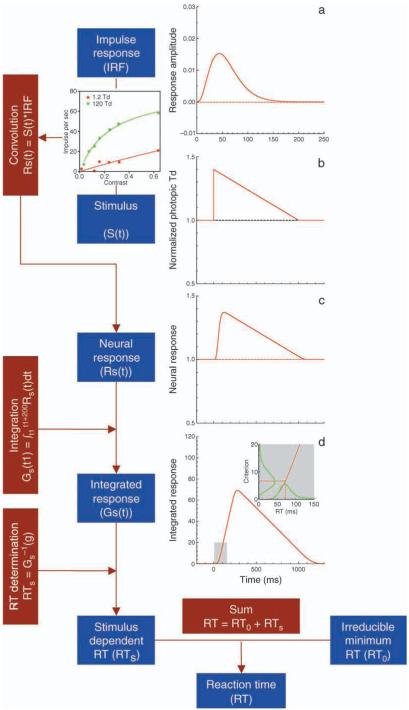
Figure 1.
The framework and mathematical equations of the impulse response/variable criterion model. (a) An impulse response function. (b) Incremental stimulus at 40%. A cell response as a function of contrast at 1.2 Td (red circles) and 120 Td (green circles) from Purpura et al. (1988) is used to illustrate MC contrast gain. Contrast gain was taken into account to calculate the effective contrast (see text for details). (c) Neural response as the convolution of the stimuli with the impulse response functions. (d) Integrated neural response used for reaction time determination, based on a time point at which the integrated difference just reaches a criterion. A variable criterion is assumed to account for variation in decision time. The lines in the insert indicate distributions of decision criterion and decision time. Only one contrast gain function is applied to the stimulus in (c) and (d) for illustration purpose.

