
Figure 5.
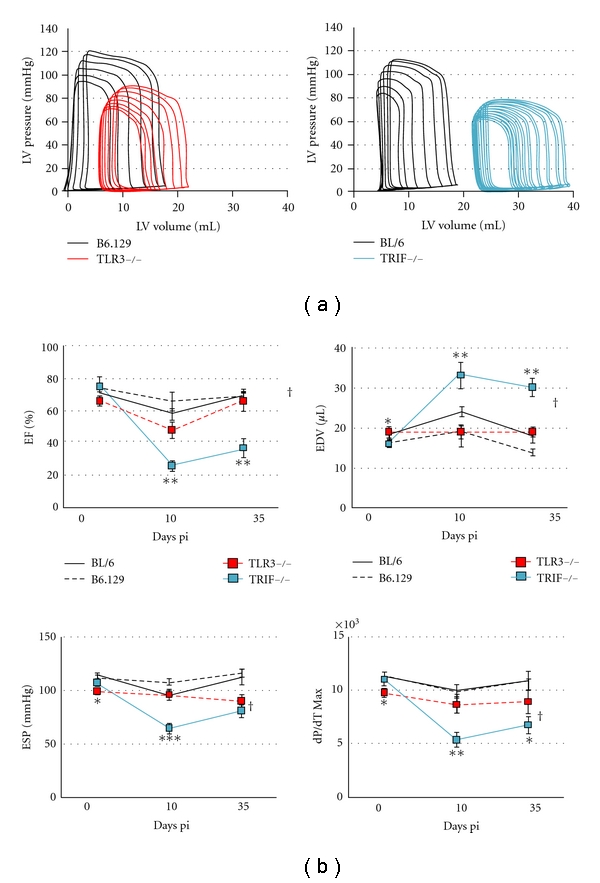
Cardiac function differs between TLR3 deficient (TLR3−/−) and TRIF−/− mice during acute and chronic CVB3 myocarditis. (a) Representative pressure-volume loops for TLR3−/− (left) and TRIF−/− (right) hearts at day 10 pi compared to their WT controls. (b) Comparison of pressure-volume relationships of TLR3−/−, TRIF−/− and WT mice at day 10 pi, n = 10 to 12 mice/group. Student's t-test compares TLR3−/− to TRIF−/− at day 0, 10 or 35 pi; *: P < 0.05; **: P < 0.01; ***: P < 0.001. ANOVA compared TLR3−/− to TRIF−/− mice over time; †, P < 0.05. EF: ejection fraction; dP/dT Max (mm Hg/s) measures the peak rate of pressure rise; ESP: end systolic pressure; EDV: end diastolic volume.