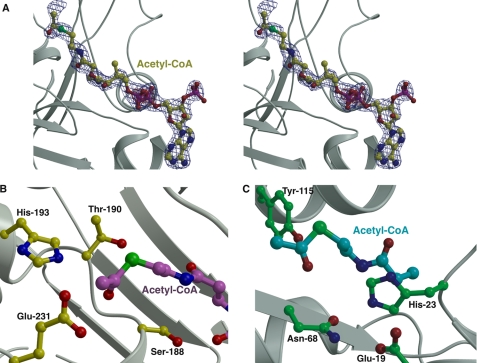
FIGURE 4.
Active site of FrbF in complex with CoA. A, stereo view of the active site pocket with the acetyl-CoA shown in yellow ball-and-stick. Superimposed is a difference Fourier electron density map (contoured at 3σ over the background in blue and at 8σ over the background in red) calculated with coefficients |Fobs| − |Fcalc| and phases from the final refined model with the coordinates of acetyl-CoA deleted prior to one round of refinement. B, close-up view of the FrbF active site in the vicinity of the acyl moiety of the bound acetyl-CoA (shown in magenta ball-and-stick). Residues that participate in acid/base catalysis are shown in yellow ball-and-stick. C, the active site of the structurally unrelated GNAT superfamily acetyltransferase RimI (Protein Data Bank code 2CNS) is shown for comparison. The acetyl-CoA is shown in green, and active site residues are shown in cyan ball-and-stick.

