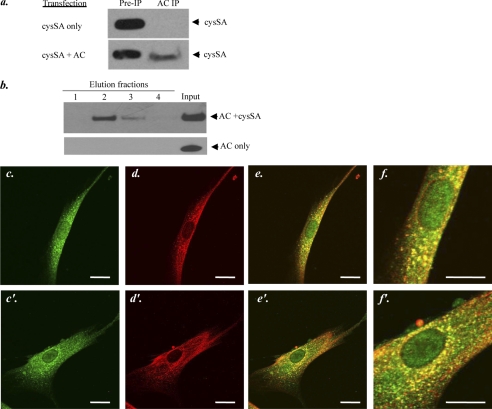
FIGURE 3.
Interaction between AC and cysSA. a, shown is co-immunoprecipitation (IP) of AC and cysSA from cell lysates after transient transfection of HEK 293T17 cells with full-length cDNAs of cysSA only or cysSA and AC together. Immunoprecipitation was performed using a polyclonal anti-AC serum. Western blotting was then performed using a polyclonal anti-cysSA antibody. These experiments indicated that immunoprecipitation of cysSA only occurred if both cysSA and AC were co-expressed. b, shown is a pulldown assay of recombinant AC and recombinant His-tagged cysSA, incubated in vitro for 24 h, or AC alone. Pulldown was performed using Ni-NTA resin followed by Western blotting and detection of AC in the elution fractions using a monoclonal anti-AC antibody. The results indicate that only in the presence of cysSA, could AC be bound to the Ni-NTA resin and detected in the elution fractions. c and c′–f and f′, shown is localization of AC and cysSA within human gingival fibroblasts, detected by immunohistochemistry. The upper (c–f) and lower (c′–f′) panels show images for two different cells. Staining was performed using anti-cysSA (red, c and c′) and anti-AC (green, d and d′) antibodies for protein detection. The upper (c–f) and lower (c′–f′) panels show staining for two different cells. Localization of the primary antibodies was visualized using a fluorescent second antibody Cy-3/2 and laser-scanning confocal microscopy. e and e′ are merged images showing co-localization of the two proteins (yellow). Scale bar = 20 μm. f and f′ are enlarged images of e and e′ to better illustrate the staining patterns. The images are representative of more than 50 cells analyzed from three independent immunostaining experiments.

