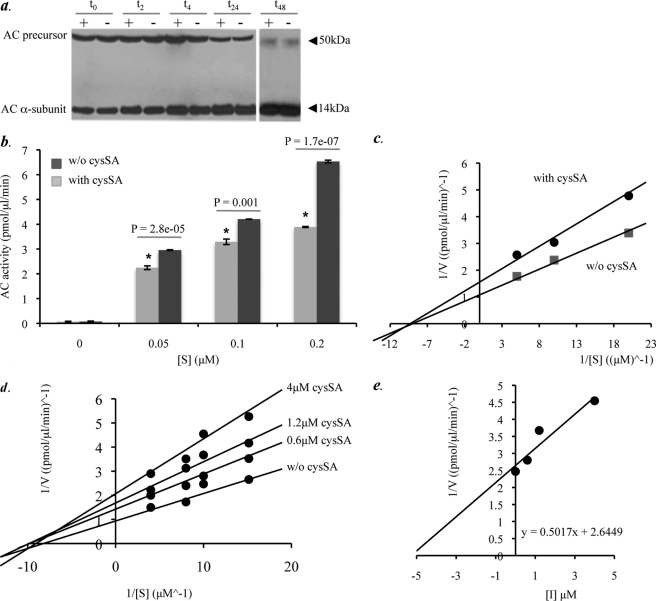
FIGURE 4.
Characterization of the AC inhibitory mechanism by cysSA. a, protein lysates were prepared from HEK 293T17 cells transiently transfected with the AC cDNA, alone (−), or in combination with cysSA (+). Cleavage of the AC precursor into the active heterodimer was then assessed by incubation of the lysates at 37 °C at several time points (2, 4, 8, 24, and 48 h). Note that AC precursor cleavage was not affected by co-expression of cysSA at any of the time points. b, AC activity in the transfected HEK 293T17 cell lysates was determined at three different concentrations of substrate (BODIPY C12-ceramide). AC activity at each substrate concentration was significantly reduced (p = 2.8e−05, p = 0.001, p = 1.7e−07, respectively (indicated by the asterisk)) in the presence of cysSA co-transfection. For these experiments equal amounts of cell lysate protein (400 μg) from the transfected cells were incubated in a 100-μl reaction mixture containing BODIPY C12-ceramide. Data represent the mean ± S.E., n = 3 independent experiments. c, shown is a Lineweaver-Burk plot for the data of b, represented by plots y = 0.1509x + 1.7023 (cysSA co-transfection) and y = 0.1069x + 1.2654 (without (w/o) cysSA co-transfection). Interception of the x axes represents −1/Km. The predicted Km values were 0.88 and 0.83 with and without cysSA, respectively. Data represent the mean ± S.E., n = 3 independent experiments. d, shown is a Lineweaver-Burk plot depicting the activity of pure, recombinant AC in the presence of three different concentrations of pure, recombinant cysSA (0.6, 1.2, and 4 μm) at four different concentrations of substrate (NBD C12-ceramide) concentrations (0.067, 0.1, 0.125, and 0.25 μm). e, shown is a Dixon plot (1/V versus [I]), used to predict the Ki through the equation y = 0.5017x + 2.6449. Data represent three independent experiments. AC inhibition was statistically significant for all of the inhibitor concentrations with p values of 0.0006, 1.24e−05, and 2.9e−07 for 0.6, 1.2, and 4 μm cysSA, respectively.

