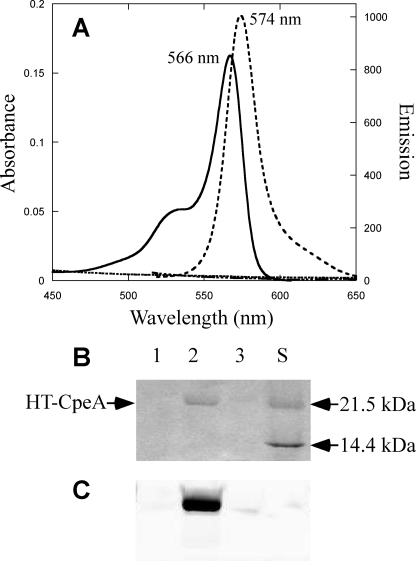
FIGURE 2.
Analyses of the specific cysteine residue on CpeA required for PEB addition by CpeY/CpeZ. A, absorbance (solid line) and fluorescence emission (dashed line) spectra of CpeA(C139S) purified from cells containing CpeA(C139S), pPebS with pCpeYZ, and the absorbance (dashed dotted line) and fluorescence (dotted line) spectra from cells containing CpeA(C82S) and pPebS with pCpeYZ are shown. To acquire the fluorescence emission spectra for the HTCpeA(C139S) produced in the presence of pCpeYZ (dashed lines in panel A), the sample was diluted 15-fold to A560 nm of 0.05; however, no dilution was performed on CpeA(C82S) (dotted line in panel A). B and C, SDS-PAGE analysis of CpeA variants; the gel was stained with Coomassie Blue (B) or visualized by zinc-enhanced fluorescence (C). CpeA variants were produced in cells that also contained pPebS and pCpeYZ. Lane 1, CpeA(C82S); lane 2, CpeA(C139S); lane 3, CpeA(C82S/C139S). Molecular mass standards are loaded in lane S, and masses are indicated to the right. C, zinc-enhanced fluorescence image of the gel pictured in panel B.

