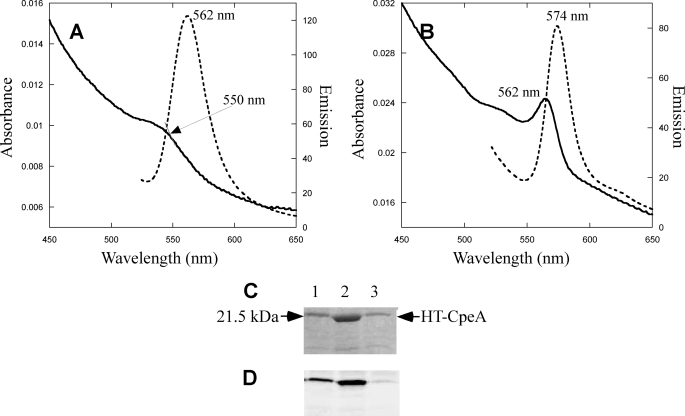
FIGURE 5.
Analyses of the cysteine residue on CpeA for PEB addition by CpeS. A, absorbance (solid line) and fluorescence emission spectra (dotted line) of CpeA(C82S) variants purified from cells containing pCpeS and pPebS. B, absorbance (solid line) and fluorescence emission spectra (dotted line) of the CpeA(C139S) variant purified from cells containing pCpeS and pPebS. C, Coomassie-stained, SDS-polyacrylamide gel analysis of CpeA variants purified from cells containing pPebS, pCpeS, and pCpeA(C82S) (lane 1), pCpeA(C139S) (lane 2), or pCpeA(C82S/C139S) (lane 3). D, the zinc-enhanced fluorescence of the gel in panel C.

