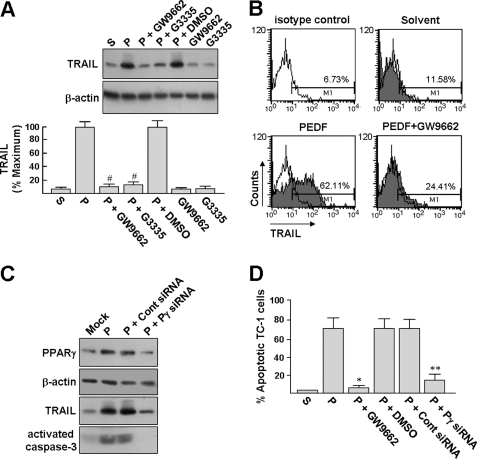
FIGURE 3.
PEDF mediates the induction of TRAIL expression by PPARγ. A, PPARγ antagonists suppress PEDF-induced TRAIL expression. BMDMs were pretreated with 10 μm GW9662 or G3335 for 1 h and then treated with or without 200 ng/ml PEDF (P) for an additional 24 h. Cells were harvested for Western blot analysis. Loading equality was confirmed with antibodies against β-actin. Representative blots and densitometric analyses with S.D. (error bars) from three separate experiments are shown. #, p < 0.005 versus PEDF + DMSO. B, surface expression of TRAIL was quantified by flow cytometry. BMDMs were exposed to PEDF or PEDF solvent for 24 h or pretreated with 10 μm GW9662 for 1 h before exposure to PEDF for an additional 24 h. The cells were then stained with PE-conjugated isotypic control or anti-TRAIL antibody for analysis by flow cytometry. Data shown are from one representative experiment of four. C, PPARγ siRNA abrogates PEDF-induced TRAIL expression. BMDMs were transfected with a PPARγ siRNA or control siRNA for 16 h and allowed to recover for a further 24 h. Mock, cells were treated with transfection reagents alone. After the respective treatment, both BMDMs and siRNA-transfected BMDMs were exposed to PEDF for 24 h, and the cells were then harvested for Western blot analysis (blots 1–3). The siRNA-transfected BMDMs were also used for coculture with TC-1 cells at an effector/target ratio of 25:1 for 16 h and then exposed to PEDF for a further 24 h, followed by detection of activated caspase-3 by Western blot analysis. Representative results from three separate experiments are shown. D, PPARγ antagonist and siRNA block the BMDM-mediated cytotoxicity induced by PEDF, GW9662, and siRNAs pretreatments were performed as described above, followed by PEDF treatment for an additional 24 h. BMDM-mediated cytotoxicity was performed at an effector/target ratio of 25:1, and cell apoptosis was detected by annexin V-FITC staining as described in the legend to Fig. 1A. *, p < 0.001 versus PEDF + DMSO. **, p < 0.02 versus control siRNA + PEDF.

