FIGURE 2.
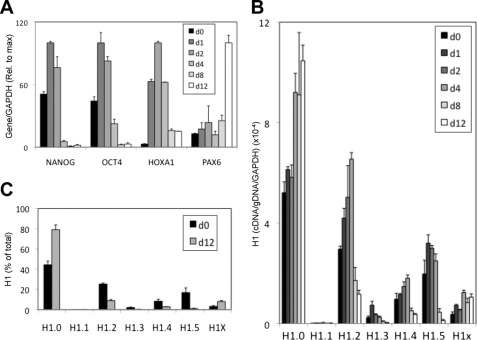
Histone H1 variant expression in the course of the RA-induced differentiation of NT2 cells. A and B, NT2 cells were incubated with RA 10−6 m for the indicated days, and the cells were processed for RNA extraction. Expression of several pluripotency, differentiation (A), and H1 genes (B) was determined by RT-qPCR with specific oligonucleotide pairs. Histone H1 variant cDNA amplification was normalized with the values of NT2-derived genomic DNA amplified with the same primers set and GAPDH expression, as described for Fig. 1B. C, proportions of histone H1 variant transcripts in undifferentiated and differentiated NT2 cells. The relative proportions of each H1 variant expression at days 0 and 12 of RA treatment were calculated from the data in B and expressed as percentages of the total H1 content. The means and S.D. of a representative experiment quantified in triplicate are shown.

