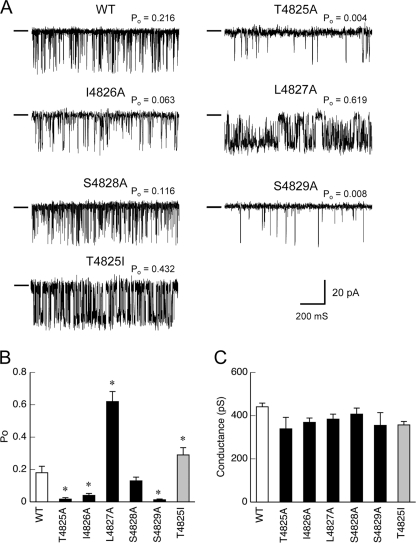
FIGURE 4.
Single Ca2+ release channel currents through WT and the mutant RyR1s. Single-channel currents were recorded at a holding potential of −40 mV (cis) in a symmetrical solution containing 250 mm cesium methanesulfonate buffered with 20 mm HEPES/Tris, pH 6.8. Free Ca2+ was set at 0.1 mm to optimally activate the channel. A, representative traces of single-channel currents through WT and the mutant RyR1 channels. The conductance level of the closed state is shown by a short line on the left side of each current recording. B, mean Po of WT and the mutant channels. C, the full open conductance of WT and the mutant channels. Data are means ± S.E. (n = 6–11). *, p < 0.05 compared with WT.

