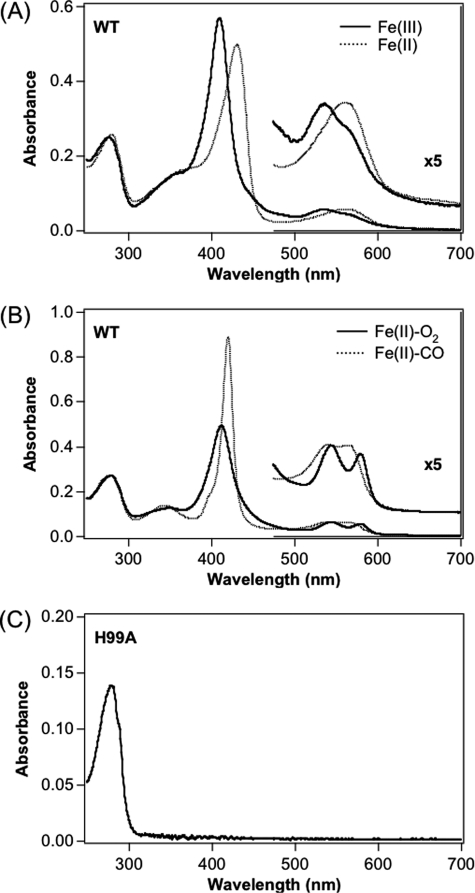
FIGURE 2.
Absorption spectra of the Fe(III) (solid line), Fe(II) (dotted line) (A), Fe(II)-O2 (solid line), and Fe(II)-CO (dotted line) (B) complexes of wild-type and H99A mutant (C) of full-length AfGcHK. Protein concentration was 5 μm, and buffer was 50 mm Tris-HCl, pH 8.0. Spectra of other Tyr-45 mutants and H183A mutant full-length AfGcHK were essentially similar to those of the corresponding complexes of the wild-type protein, as summarized in Table 1.

