FIGURE 3.
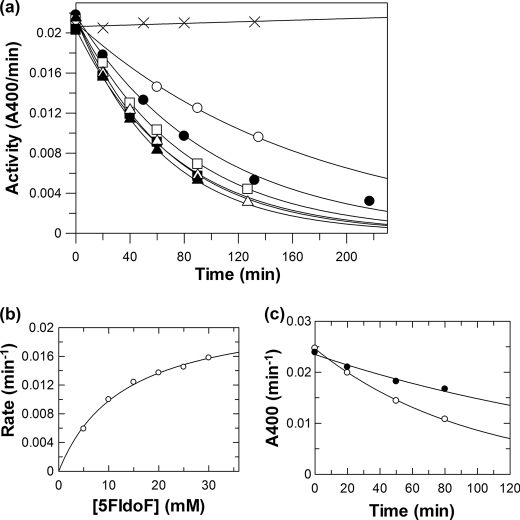
Inactivation of TreS by 5FIdoF at 37 °C. a, plot of residual enzymatic activity versus time at different inhibitor concentrations: ×, 0 mm; ○, 5 mm; ●, 10 mm; □, 15 mm; ■, 20 mm; △, 25 mm; and ▴, 30 mm. b, replot of inactivation rate constants versus concentration of 5FIdoF. c, inactivation of TreS by 10 mm 5FIdoF in the absence (○) and the presence (●) of 5 μm casuarine at 37 °C.

