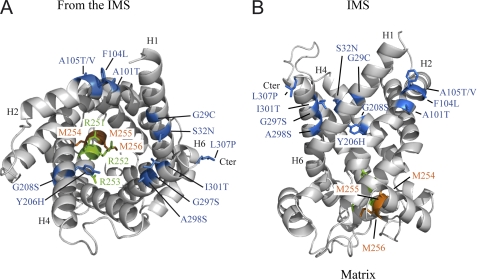
FIGURE 5.
Location of second-site mutations on a three-dimensional model of ScAnc2p generated as described in the legend of the Fig. 3. Shown is a ribbon diagram of the carrier viewed from the IMS (A) and viewed from the side (B). The Ancp signature sequence is highlighted, with methionyl residues 254 (parental mutation), 255, 256 indicated in orange and arginyl residues 251–253 indicated in green. The 12-s-site mutations detected after selection of revertant strains from yeast bearing the M254A mutation are shown in blue. The putative transmembrane segments, H1, H2, H4, H6, and the C-terminal extremity (Cter) encompassing the second-site mutations are indicated. Ribbon diagrams were drawn using PyMOL v0.99 (DeLano Scientific LLC).

