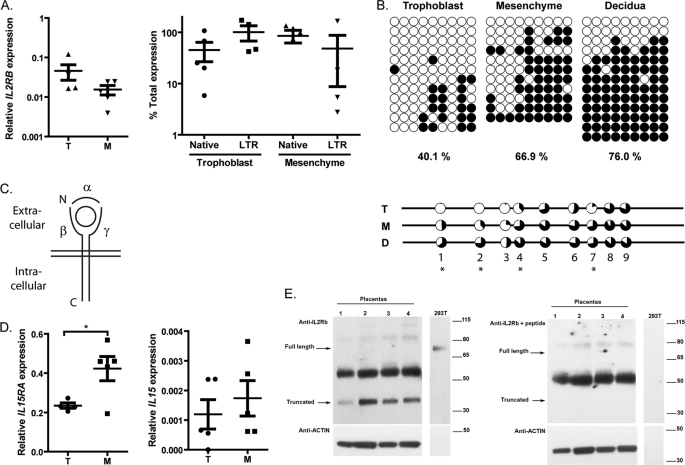
FIGURE 5.
Regulation of IL2RB and associated proteins in placental tissues. A, total IL2RB expression (left) and promoter use (right) in paired trophoblast (T) and mesenchyme (M) samples (n = 5). Each dot represents an individual biological replicate, and error bars represent the S.E. GAPDH was used as a control. B, DNA methylation of the IL2RB LTR in trophoblast, mesenchyme, and decidua from one individual (upper) and average of multiple samples (n = 3) (lower) determined by DNA methylation as represented in Fig. 3. Percentages shown are the average methylation of all samples. C, schematic representation of the IL-2 or IL-15 receptor with α, β, and γ chains represented by solid lines and the bound cytokine represented as a circle. The plasma membrane is indicated by the parallel lines. D, expression of IL15RA (left) and IL15 (right) in trophoblast (T) and mesenchyme (M) samples (n = 5). Each dot represents an individual biological replicate, and error bars represent the S.E. Asterisks indicate statistical significance (*, p < 0.05) as determined by Student's t test. E, Western blot on protein extracts from four placental samples and a positive control (293T transfected cells) detected with anti-IL2RB (left panel) and anti-IL2RB preincubated with a competing peptide (right panel) and anti-actin loading control (lower panels). Bands present only in the left panel are specific IL2RB proteins, whereas the strong ∼52-KDa band in placenta is nonspecific. Please note that the amount of 293T protein extract is low, and therefore, no actin is observed. For a Western blot containing more protein extract, see supplemental Fig. S5A. The same results were obtained with another anti-IL2RB antibody and can be seen on supplemental Fig. S5, B and C. Placentas 1, 2, 3, and 4 correspond to samples 114, 144, 133, and 132.

