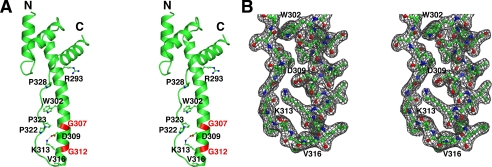
FIGURE 2.
Structure of the activase C-domain. A, stereo image depicting the C-domain fold with select side chains shown in ball-and-stick model. The salt bridge between Asp-309 and Lys-313 is represented by a dashed line, and the positions of Gly-307 and Gly-312 are highlighted in red. B, stereo image of the 2Fo − Fc electron density (1 σ) for the remote end of the paddle-like extension.

