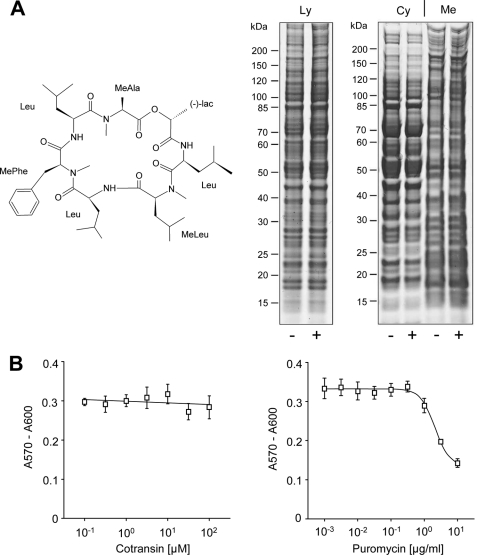
FIGURE 2.
Cotransin toxicity assays. A, chemical structure (left panel) and SDS-PAGE analysis (right panel) of HEK 293 cell proteins. Cells were treated with 30 μm cotransin (+) or DMSO (−). Total lysates (Ly) or cytosolic (Cy) and crude membrane proteins (Me) were loaded on a SDS gradient gel (4–12%). B, cell viability assay. Following treatment of cells with increasing concentrations of cotransin (left panel) or puromycin (right panel), HEK 293 cells were preloaded with AlamarBlue redox indicator, and its metabolic reduction was analyzed (measurement wavelength λexc, 570 nm; reference wavelength λem, 600 nm). Data points indicate cell viability and represent mean values of the A570/A600 difference of three independent experiments each performed in triplicate (±S.D.).

