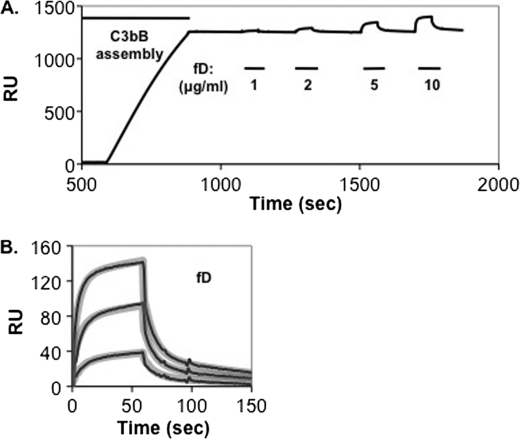
FIGURE 4.
Interaction of factor D with stable surface-bound C3bB(Mg2+). A., C3b (8514 response units (RU)) was covalently attached to a biosensor surface and treated for 300 s with 2 μg/ml factor B D254G/N260D/233AAA in Mg2+ HEPES buffer followed by buffer alone. Complexes were then treated for 60 s with different concentrations of factor D (indicated by the bars below the profile). The profile indicates stable C3bB complexes formed with 29% of the surface-bound C3b and the maximum C3bBD complexes formed with 44% of the surface-bound C3bB. B, profiles in A of factor D interactions with C3bB were aligned at t = 0 and subjected to kinetic analysis using a two-state conformational change model (10) and the BIAevaluation software. The thin black lines represent the original data profiles, and the thick gray lines represent the global best fit (see calculated kinetic constants in Table 1).

