
Figure 9.
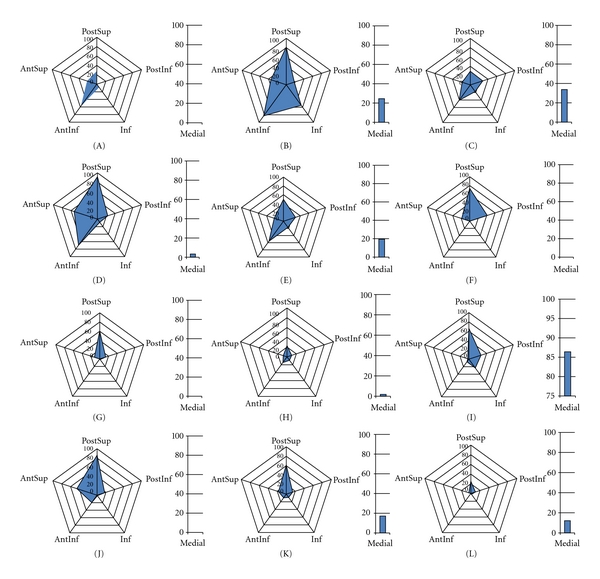
Radar plots of TrABL ratios per anatomical subregion (for twelve specimens A to L, as specified in Table 1) (PostInf: posteroinferior, Inf: inferior, AntInf: anteroinferior AntSup: anterosuperior, PostSup: posterosuperior.) The ratio for medial subregion (Med) is added with a separate bar graph.