
Figure 3.
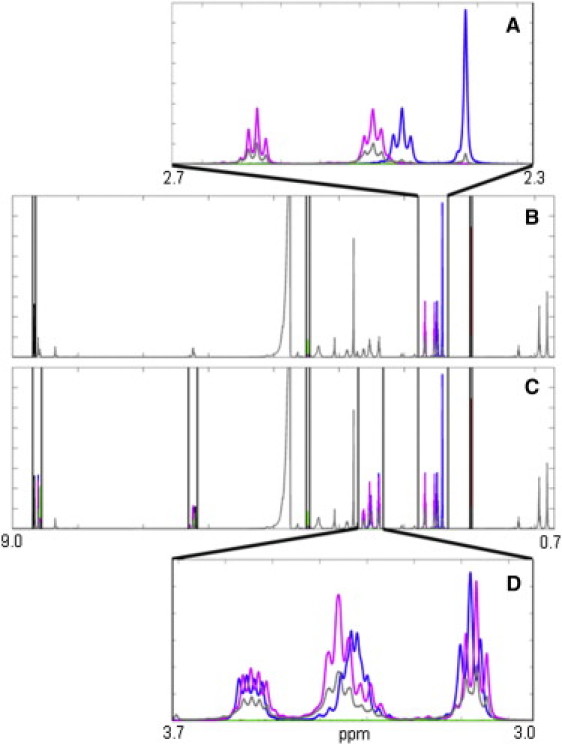
Choosing a location to perform peak fitting. (A) Detail of one of the diagnostic windows. (B) Diagnostic peak (i.e., relatively isolated peaks that are easy to distinguish from preacquired spectral standards) windows (indicated by vertical bars) used for peak location determination (using NMD) and an initial peak fitting analysis. Blue, AcCoA; red, acetate; black, AMP; green, ATP; magenta, CoA; dotted blue line, time-averaged spectrum from experiment. (C) A larger set of windows used for MPSF. Vertical bars demarcate the spectral windows used. (D) Detail of a window in which multiple peaks overlap. Once the exact location of the spectral standards has been determined, the overlapping spectra in this window are used to perform MPSF.