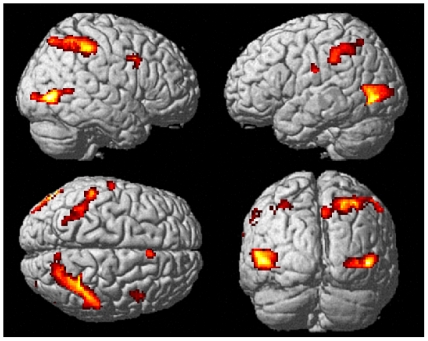
Figure 2. Grand-average comparison of Stop-trials versus Go-trials from the Stop-irrelevant task blocks (activation maps thresholded at T>3 (uncorrected) and cluster size k>10).
Activity differences were most prominent in occipito-temporal and parietal areas but were also present in the right IFJ and pre-SMA (note that only the large parietal and occipital clusters survived strict cluster-level correction for multiple comparisons).

