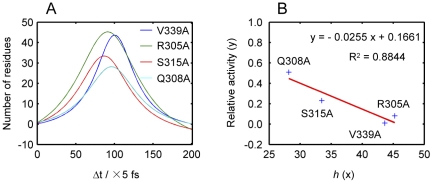
Figure 6. Influences of different E. coli aspartokinase III mutations and its linear correlation.
(A) Characterization of the influences of different mutations on their energy dissipation curves using Lorentz equation. (B) Linear correlation between the relative inhibitions of aspartokinase III mutations and the h values derived from their Lorentz equations.

