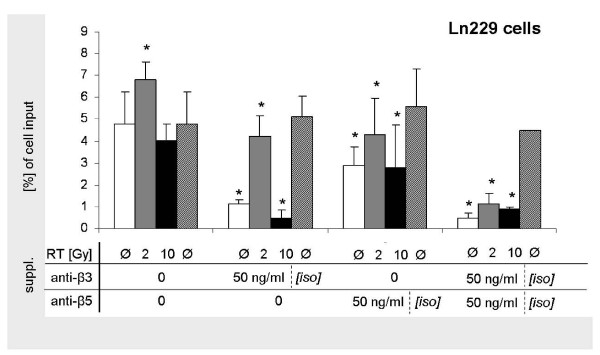
Figure 5.
Inhibiton of Ln229 glioma cell migration by integrin inhibition. Quantitative analysis of Vn-based transmigration of Ln229 glioma cells following single photon doses of 0, 2, and 10 Gy without and with the addition of 50 ng/ml anti-ανβ3- and -ανβ5-antibodies and corresponding isotype controls. Display of mean value ± standard deviation (SD); statistical analysis using Student's t-test (*, indicating significance p < 0.05)

