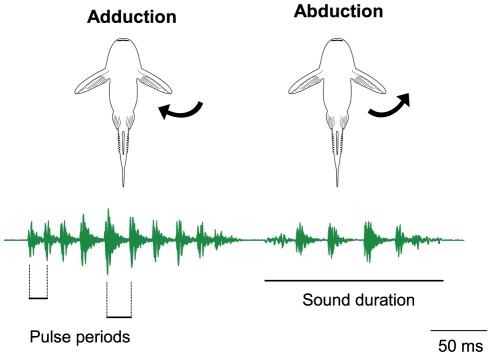
Figure 9. Drawings of the ventral side of the catfish and oscillogram of an AD- and AB-stridulation sound.
The upper drawings illustrate the fin movement during production of AB- and AD-sounds, the lower oscillogram shows temporal sound characteristics measured. Sound duration was measured from the beginning to the end of a sound. The pulse period was defined as the time between the peak amplitudes of two subsequent pulses within a sound. A minimum and a maximum pulse period are shown within a stridulatory sound.

