
Figure 3.
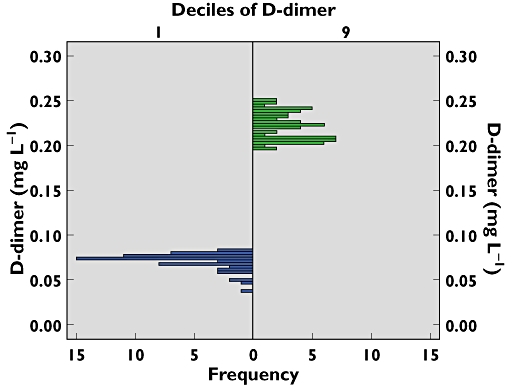
Histogram of d-dimer in the second and ninth decile of F 1 + 2 recorded in young. Women [60]. Each group contained between 50 and 60 individuals. d-dimer is chosen as the most robust analyte. The first and tenth deciles are avoided due to increased variations in the values