Figure 4.

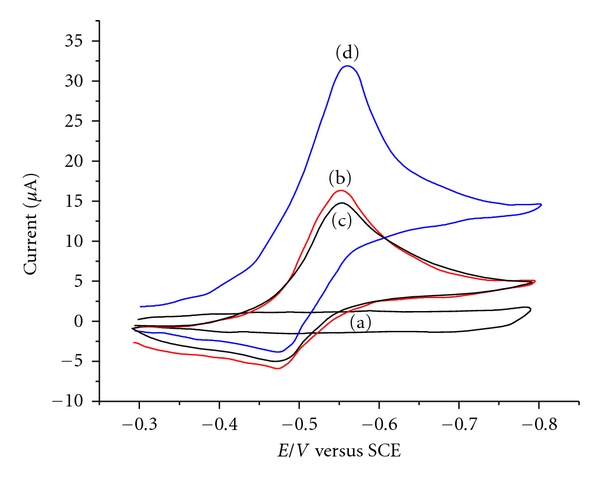
Cyclic voltammograms of (a) GCE/nafion-Au NPs/AFP Ab1 and (b). (a) in 5 mmol/L CP and 1 mmol/L OPD; (c) (a) in response to 1% BSA and (d) 50 ng/mL AFP.

Cyclic voltammograms of (a) GCE/nafion-Au NPs/AFP Ab1 and (b). (a) in 5 mmol/L CP and 1 mmol/L OPD; (c) (a) in response to 1% BSA and (d) 50 ng/mL AFP.