Figure 6.

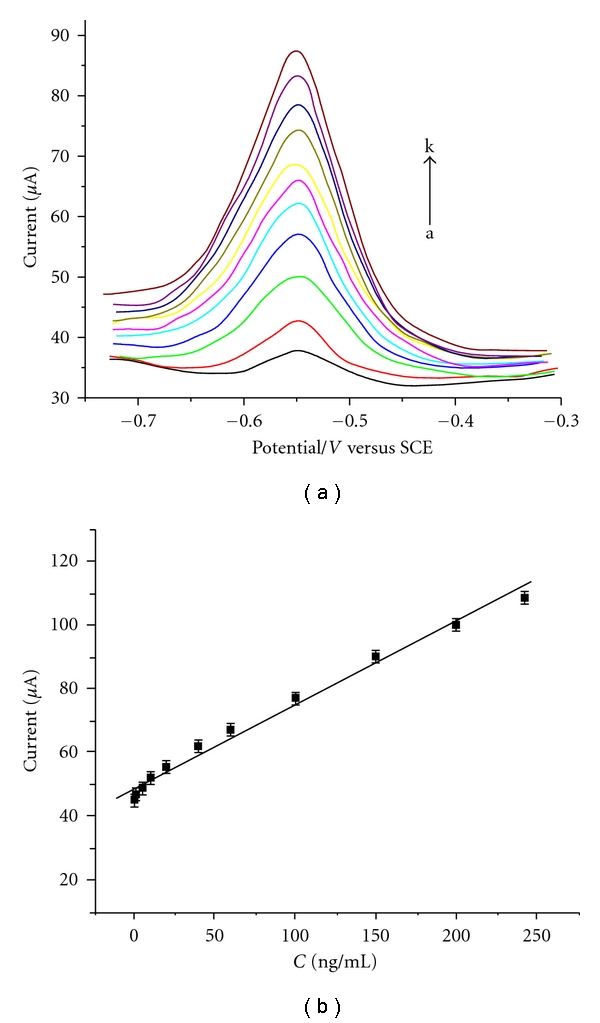
(a) Differential pulse voltammograms of the immunosensor for AFP at various concentrations (from a to k: 0, 1, 5, 10 20, 40, 60, 80, 100, 150, and 200, (b) the calibration curve for the detection of (AFP) under optimal condition.

(a) Differential pulse voltammograms of the immunosensor for AFP at various concentrations (from a to k: 0, 1, 5, 10 20, 40, 60, 80, 100, 150, and 200, (b) the calibration curve for the detection of (AFP) under optimal condition.