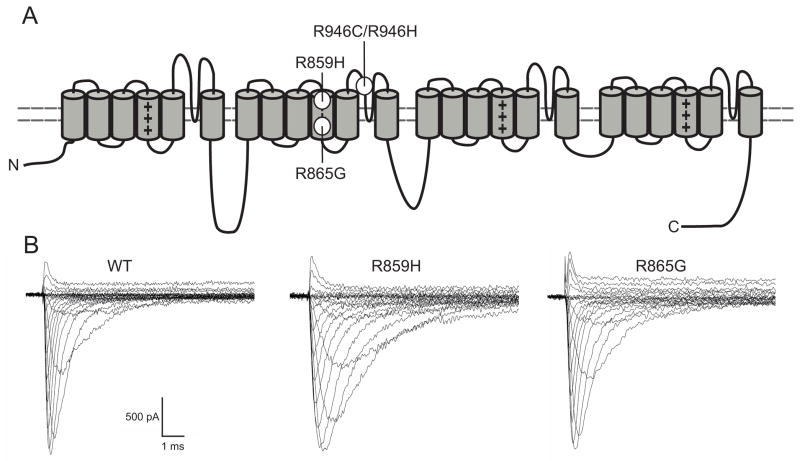
Figure 1. Mutation location and representative WT and mutant Nav1.1 whole cell currents.
A) Schematic representation of the Nav1.1 channel. The S4 voltage sensors are marked with plus signs (+). The locations of the mutations are as depicted. B) Assembled sodium currents elicited by increasingly depolarizing pulses. Representative sodium currents recorded from tsA201 cells expressing WT, R859H or R865G ion channels in combination with β1 and β2 subunits. Currents were activated by depolarizing voltage steps ranging from −80 mV to +90 mV in increments of 5 mV. Both mutants produced functional sodium currents, which were similar in amplitude as WT currents (Student’s t-test, WT n=13; R859H n=12, P=0.89; R865G n=10, P=0.97). See Methods and inset figure 2B for pulse protocol.

