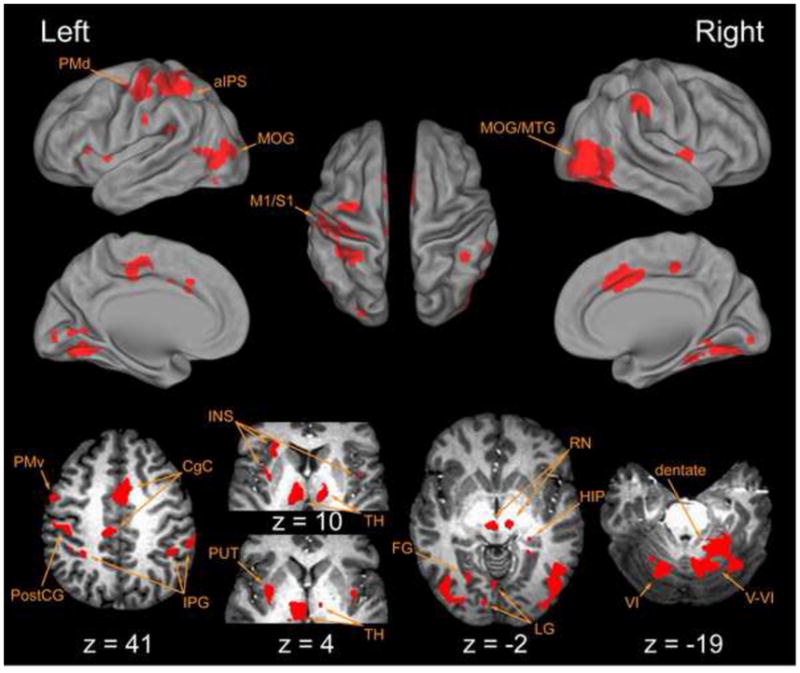
Figure 5.

Voxel-wise t-tests compared fit coefficient values versus 0.0, identifying regions that showed a statistically significant correlation between the hemodynamic response and the “GO” cue regressor. Lateral, medial and dorsal surface plots (top) and axial views (bottom) indicate cortical regions with BOLD signal components generally correlated with task execution. Here and elsewhere, left hemispheric activities are shown to the left of each panel. Abbreviations: aIPS anterior intraparietal sulcus; CgC cingulate cortex; FG fusiform gyrus; HIP hippocampus; INS insula; IPG inferior parietal gyrus; LG lingual gyrus; M1 primary motor cortex; MOG middle occipital gyrus; MTG middle temporal gyrus; PMd dorsal premotor cortex; PMv ventral premotor cortex; PostCG post central gyrus; PUT putamen; RN red nucleus; S1 primary sensory cortex; TH thalamus; V cerebellar lobule V; V1 cerebellar lobule V1.
