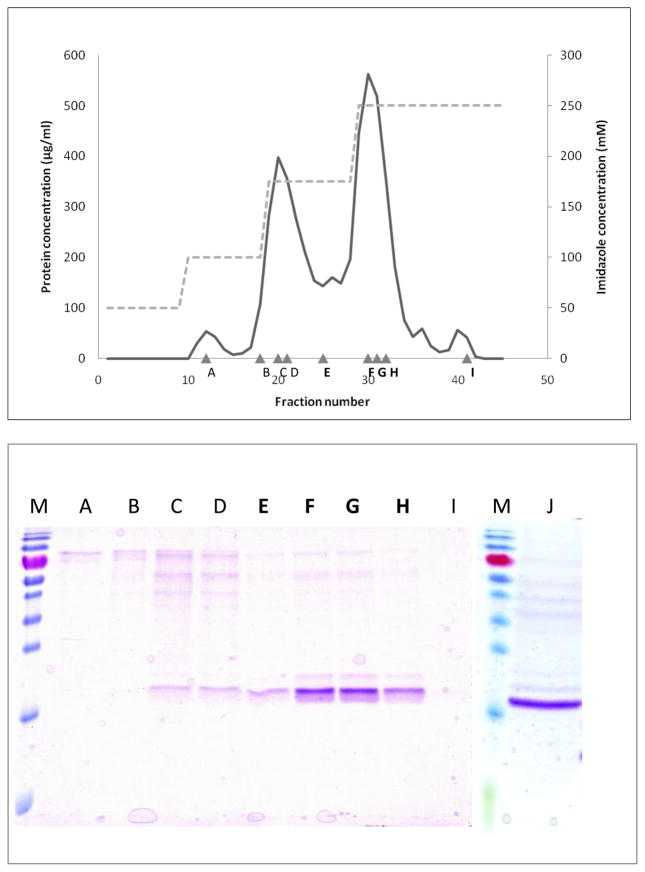
Figure 3.
A: Elution pattern of EUL domain from ArathEULS3 from Nickel-Sepharose. Full line: protein absorbtion measured at 280 nm. Dashed line: stepwise elution with increasing concentrations of IZ (50-100-175-250 mM) in Tris buffer. Triangles: number of analyzed fractions.
B: SDS-PAGE of eluted fractions from Nickel-Sepharose. M: Prestained protein marker (Fermentas). A–I refer to fractions indicated in Fig. 3A. Lane J shows the purified EUL domain from ArathEULS3.

