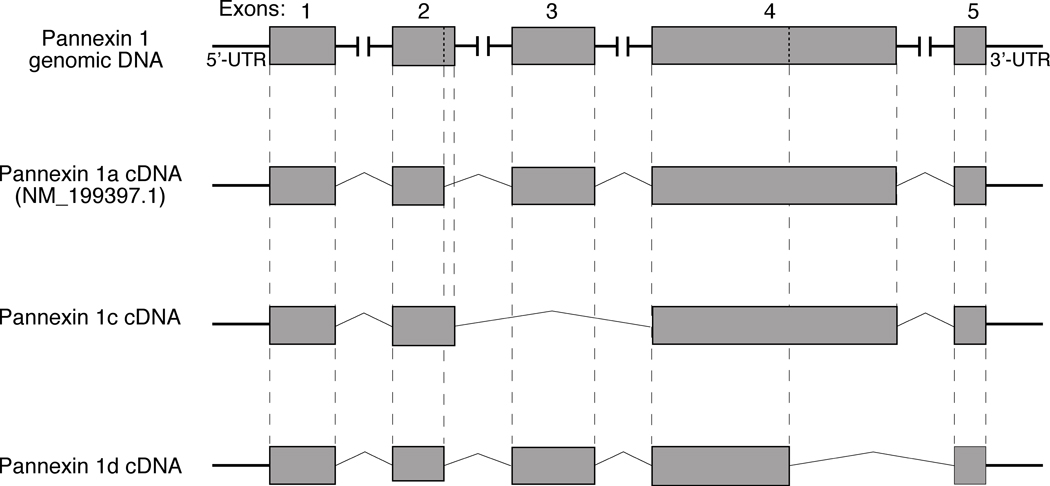
Fig. 3.
Schematic representation of cDNA structures for Panx1 isoforms from rat pituitary cells. Top panel illustrates rat Panx1 genomic DNA. Putative translational exons in the genomic DNA are boxed in gray and horizontal lines illustrate four introns and 5’-UTR and 3’-UTR endings. Vertical dotted lines in exons 2 and 4 show the position of additional splicing sites for Panx1c and Panx1d, respectively. Bottom panels are schematic representation of cDNA for Panx1 splice variants. Vertical dashed lines show the corresponding regions between putative translational exons in the genomic DNA and Panx1 cDNAs.

