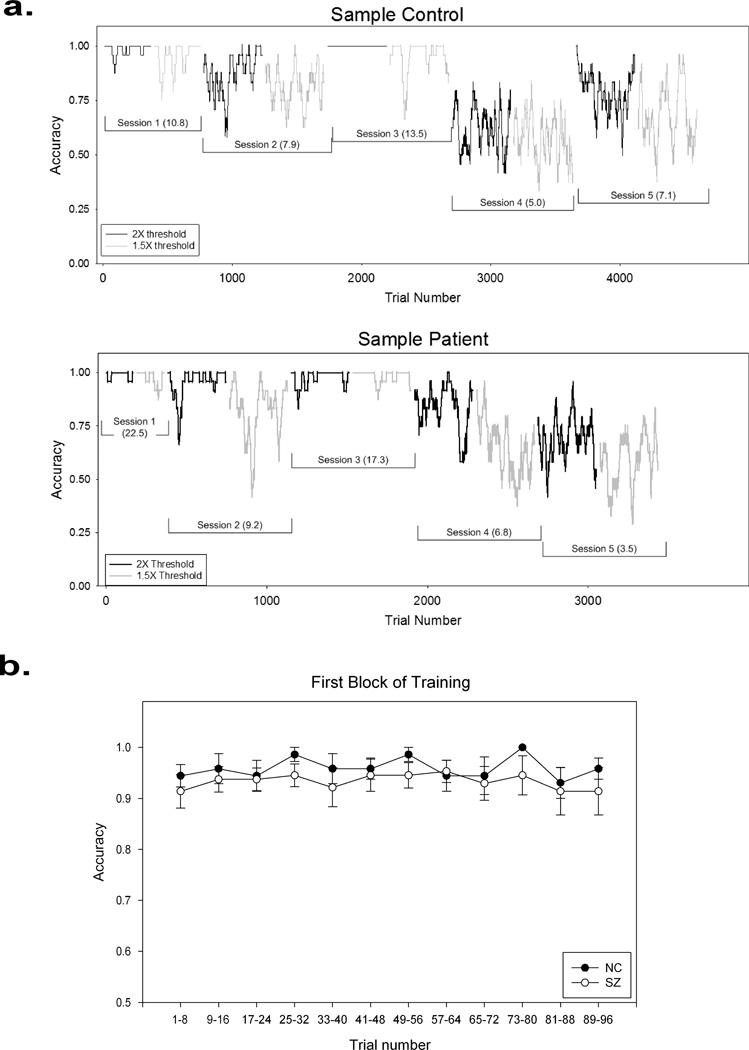
Figure 4.
a. Performance during training from a sample control (top panel) and patient (bottom panel). Abscissa represents trial number. Ordinate represents accuracy throughout a training session, which was obtained by averaging with a sliding window of 24 trials. Each accuracy point on the graph represents the average of one such window. The first point on the graph is the accuracy of the first 24 trials, and the second point is the accuracy of trials 2 to 25, etc. Normally, the 2X threshold trials (easier) were completed before the 1.5X threshold trials in each session, as was the case for these two examples. The training sessions are marked along with current perceptual thresholds (in parentheses), which were measured at the beginning of the each session. In general, lower thresholds are associated with lower training accuracies. b. Performance accuracy during the first block of training on Session 1. Accuracy was averaged over eight trials at a time, and then across subjects in each group. Error bars represent 1 standard error.

