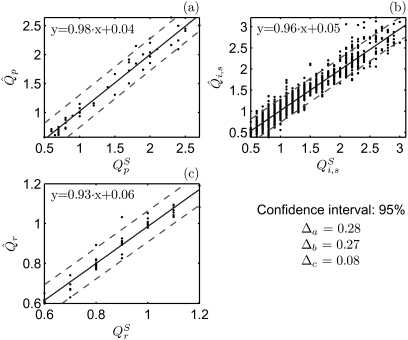
Figure 7.
Comparison between the adapted optimization parameters and pre-defined values . The solid lines indicate the regression lines for the optimization parameters. The corresponding regression functions are shown including the 95% confidence interval. The distances between the regression lines and the confidence interval boundaries are indicated (Δa, Δb, Δc exhibiting the reliability of the algorithm).

