Abstract
Purpose
To establish the correspondence between the two histologically observable and diffusion tensor magnetic resonance imaging (DTMRI) measurements of myolaminae orientation for the first time and show that single myolaminar orientations observed in local histology may result from histological artifact.
Materials and Methods
DTMRI was performed on six sheep left ventricles (LV), then corresponding direct histological transmural measurements were made within the antero-basal and lateral-equatorial LV. Secondary and tertiary eigenvectors of the diffusion tensor were compared to each of the two locally observable sheet orientations from histology. Diffusion tensor invariants were calculated to compare differences in microstructural diffusive properties between histological locations with one observable sheet population and two observable sheet populations.
Results
Mean difference ± one standard deviation between DTMRI and histology measured sheet angles was 8° ± 27°. Diffusion tensor invariants showed no significant differences between histological locations with one observable sheet population and locations with two observable sheet populations.
Conclusion
DTMRI measurements of myolaminae orientations derived from the secondary and tertiary eigenvectors correspond to each of the two local myolaminae orientations observed in histology. Two local sheet populations may exist throughout LV myocardium and one local sheet population observed in histology may be a result of preparation artifact.
Keywords: DTMRI, myocardium, cardiac sheets, histological validation, myofiber
INTRODUCTION
The complex, but highly organized arrangement of myocytes within the left ventricle (LV) underlies the anisotropic mechanical (1–4) and electrical (5,6) function of the heart. Myocytes form so called “myofibers” and are arranged in a transmural helical pattern. Myocyte organization is further characterized by a lengthwise branching network and two-to-four cell thick layers, which form myolaminar sheets within an extracellular collagen matrix (2,3,7).
Previous observations of the sheet structure have primarily relied on histological methods such as electron microscopy (2,3), confocal microscopy (8,9), or optical microscopy (7,10). Such methods for quantifying both myofiber and myolaminar geometry are exceedingly tedious, especially for whole heart surveys (3) and don’t lend themselves to spatially registered measurements for entire hearts.
More recently, however, diffusion tensor magnetic resonance imaging (DTMRI) methods have been developed, which enable the non-destructive evaluation of soft tissue microstructure. DTMRI methods quantify the self-diffusion tensor of water as water undergoes Brownian diffusion within the tissue microstructure. The diffusion tensor is estimated within each image voxel and can be decomposed into an eigensystem of three eigenvectors and three eigenvalues. The primary eigenvector (E1), which is associated with the largest (primary) diffusion eigenvalue (λ1), defines the direction of maximum diffusion and has been shown to correspond to the myofiber long-axis using quantitative histological methods (11–16). The secondary (E2) and tertiary (E3) eigenvectors similarly correspond to cross-fiber direction (within the sheet and orthogonal to the myofiber long-axis) and the sheet-normal direction (11,12,17). The ability of DTMRI to quantify myolaminar geometry has previously been validated using nonstandard histological methods (17).
The original description of the myolaminar sheet structure illustrated a single sheet population. More recently, however, biomechanical studies (10) and histological examination (7–9), have suggested the existence of a second sheet population. The two sheet populations are thought to be mutually orthogonal (or nearly so) and to co-exist within small, histologically observable tissue volumes. In fact, the established histological method of measuring myolaminar orientation (7) is often subjective due to the frequent presence of two observable sheet orientations. Whereas DTMRI estimates of the two local sheet populations can be ranked according to their respective eigenvalues (λ2 or λ3), histological estimates of sheet orientation provide no means for distinguishing between the two apparent populations.
The objective of this study was to establish the correspondence between the two histologically observable myolaminar orientations (sheet angles, β) and DTMRI measurements for the first time. We hypothesize that the secondary and tertiary eigenvectors of a voxel’s diffusion tensor correspond to each of the two local myolaminar sheet orientations observed in histology. We also hypothesize that due to preparation artifacts, histology may obscure the second sheet population when in fact two local sheet populations always exist.
Establishing DTMRI measurements as an adequate alternative to quantitative histology is advantageous because it avoids tedious and subjective histological methods and provides quantitative measures of tissue microstructure with perfect three-dimensional registration.
Using perfusion fixed sheep hearts, we will show that secondary and tertiary eigenvector estimates of the local sheet orientations correspond with histological measurements of the two sheet orientations in the same location of the same heart. The correlation of the primary eigenvector’s local fiber orientation with histological fiber measurements will also be shown for completeness. Additionally, we will show that there are no statistical differences in diffusion tensor characteristics between histological locations showing one local sheet population and locations showing two local sheet populations, indicating that all myocardial tissue is comprised of two local sheet orientations.
MATERIALS AND METHODS
Ovine Heart Tissue Preparation
All animals used in this study received humane treatment according to local institutional and federal guidelines. The animals used in this study are a subset of those previously used as a control group in a study of chronic mitral regurgitation (18,19). Additional detail about the experimental procedures is available (18,19) and the salient details are briefly reported herein. Sheep in the control group underwent left thoracotomy for the transmural implantation of miniature tantalum markers in the antero-basal (ANT) and lateral-equatorial (LAT) wall, which were used for previous studies of cardiac kinematics and for anatomical registration purposes herein. At the end of the twelve-week study the animals were euthanized with an injected bolus of potassium chloride (80 mEq) while under sedation with inhalational isoflurane (19). Subsequent to euthanasia the left ventricular pressure was adjusted to match the in vivo measured end-diastolic pressure by means of controlled exsanguination. The coronary ostia were cannulated with balloon catheters and 300 mL of buffered glutaraldehyde (5%) was infused to fix the myocardium. The heart was then excised by cutting the great cardiac vessels, grossly exsanguinated and rinsed with saline, then stored in 10% formalin for later histological processing. Six adult male sheep hearts (N=6) from the original control group were examined with both “gold standard” histological methods and DTMRI and formed the study cohort for this report.
Diffusion tensor magnetic resonance imaging and image processing
The formalin fixed left ventricular myocardium was prepared for DTMRI by placing the tissue in a custom built plastic container with o-ring seals and both a luer-lock supply and vent cap through which a susceptibility matched fluid (Fomblin Y-LVAC 6–06, Solvay Solexis, West Deptford, NJ) was injected into the container, immersing the heart. The heart was held in place within the container using open-cell foam and oriented to grossly align with the long axis of the container and subsequently the MRI scanner.
A two-dimensional, slice-interleaved, diffusion weighted, twice-refocused spin echo, echo-planar pulse sequence was used to acquire diffusion tensor data in the fixed hearts using a 1.5T GE Signa Excite scanner and an 8-channel head coil. The following pulse sequence parameters were used: TE/TR = 84 ms/4800 ms, b-value = 1500 s/mm2, 55 non-colinear and non-coplanar encoding directions (20), nine non-diffusion weighted image volumes, echo train length of 4 (i.e. 32 shots), 4 averages, and ±62.5 kHz bandwidth. The in-plane imaging resolution was 1 mm × 1 mm × 3 mm obtained by using a 128×128 encoding matrix, 40 interleaved slices and a 128 mm × 128 mm × 120 cm imaging volume. The median SNR was calculated for each heart and the mean ± standard deviation of the medians for all hearts was 32±3. The total imaging time for each volume was 10.2 minutes, for a total imaging time of 10.2 hours per heart. After scanning the heart was returned to 10% formalin until the time of histological processing.
Diffusion tensors were reconstructed from the diffusion weighted images using linear regression. The diffusion eigensystem and the three orthogonal tensor invariants (norm, fractional anisotropy, and mode) (21) were calculated for each imaging voxel’s diffusion tensor. Diffusion tensor invariants provide a basis for comparing components of tensor shape between different regions and are a tool for quantifying differences in regional microstructure. Tensor norm measures the magnitude of the isotropic component of the tensor, fractional anisotropy (FA) measures the magnitude of the anisotropic component of the tensor, and tensor mode defines the kind-of-anisotropy (e.g. planar anisotropic, orthotropic, or linear anisotropic) (21). All computations were performed using Matlab (The Mathworks, Nattick, MA).
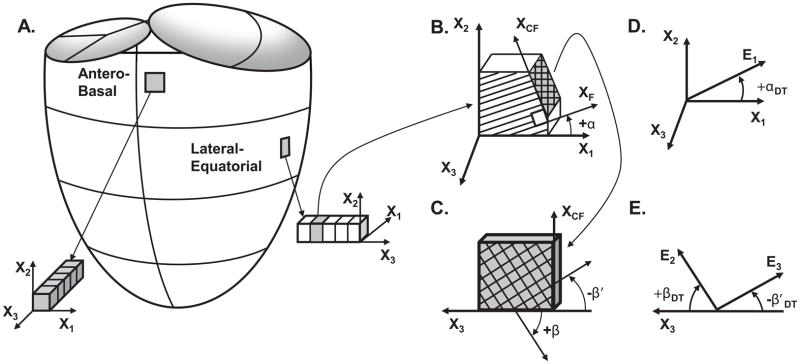
In order to measure fiber and sheet orientation from the DTMRI data, a local coordinate system was defined within each myocardial voxel. The right-handed “cardiac” Cartesian coordinate system used by Harrington et al. (7) and others provides a local set of orthogonal axes consisting of a circumferential axis (X1) pointing counter-clockwise when viewed from base to apex in an axial DTMRI slice and, for example, tangent to the epicardial surface; a longitudinal axis (X2) pointing from the apex toward the base and through the aorto-mitral meatus; and a radial axis (X3) pointing from endocardium to epicardium. This local coordinate system was defined for every voxel occupied by myocardial tissue as depicted by Figure 1. The high myocardial contrast-to-noise ratio provided by the high image SNR and the use of Fomblin embedding solution for DTMRI permits facile delineation of myocardium from background. Myocardium was segmented from non-myocardium within each short axis imaging plane by manually segmenting the high quality non-diffusion weighted images in ImageJ (National Institute of Health, Bethesda, MD). Non-myocardial voxels with high signal intensities, such as fat and post-surgical adhesions, were manually segmented as non-myocardium on a voxel by voxel basis to ensure smooth epicardial and endocardial boundaries. Furthermore, the sites selected for analysis were not immediately adjacent to either papillary muscle. The relatively smooth ovine endocardium further facilitated border delineation.
Figure 1.
Myocardial fiber and sheet angles were measured using quantitative histological methods within transmural tissue blocks from the antero-basal or lateral-equatorial wall (A). The local cardiac coordinate system and local fiber angle is depicted in (B), wherein the local circumferential axis (X1), longitudinal axis (X2), radial axis (X3), fiber axis (XF) and cross-fiber axis (XCF) are defined and used to quantify the local fiber angle (α). An en face view of the X3-XCF plane in (C) allows depiction of the two sheet angles (β and β′). Fiber and sheet angles were also measured using DTMRI. The DTMRI fiber angle (αDT) was defined using the primary eigenvector (E1) and local circumferential axis (X1) in (D). The DTMRI measured sheet angles (βDT and β′DT) were defined using the secondary (E2) and tertiary eigenvectors (E3) and the local radial axis (X3) in (E).
The local longitudinal direction, X2, was identical for every voxel of each heart. The local X1 and X3 vectors were constrained to lie in the plane normal to X2, thus X1 and X3 did not necessarily lie in the short-axis imaging plane. X1 and X3 were derived from periodic cubic b-splines and twenty control points fitted to the epicardial and endocardial contours of the short-axis slice containing the ANT or LAT region of interest for each individual heart (Figure 2A). Linear weighting of the control point values provided a means to generate four additional intramural contours. The local b-spline tangent direction was used to define the X1 direction constrained to lie within the plane normal to X2. The local X3 direction was defined as the cross-product of the local X1 and X2 and pointed in the endocardial-to-epicardial direction (Figure 2B).
Figure 2.
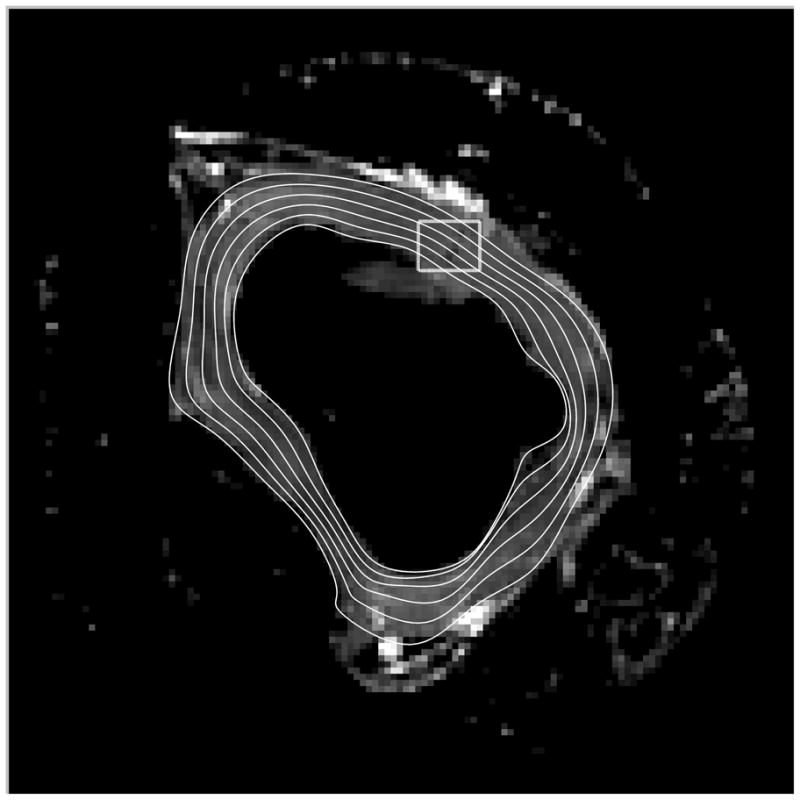
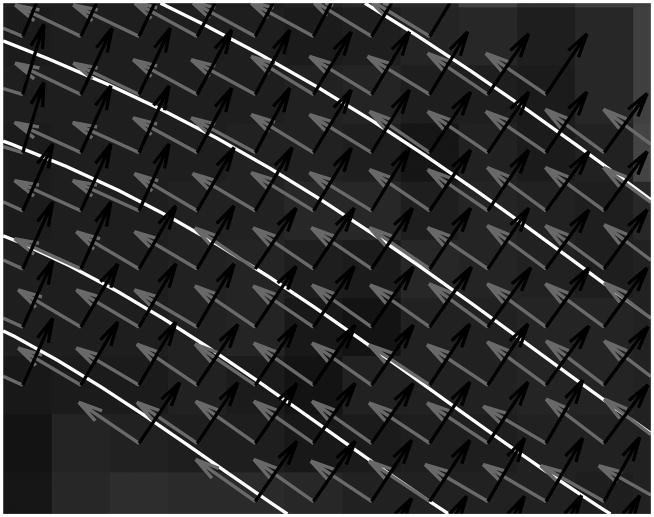
(A) Epicardial and endocardial contours (white) were derived from b-spline polynomials fitted to segmented images of individual LV short-axis slices and is shown overlaid on the corresponding non-diffusion weighted axial MR image. The intramural contours were derived by weighting the b-spline weights at each control point and these contours were subsequently used to define local circumferential (X1, gray) and radial (X3, black) vectors (B), which is a zoomed-in view from the box in (A).
Within the local, cardiac coordinate system, the local fiber angle (αDT) was measured using the angle subtended by the primary eigenvector (E1) and the vector defining the local X1 for each voxel in Matlab using Equation [1]:
| [1] |
Fiber angles were defined on the interval of [−90°, +90°] with a negative αDT defined by a clockwise rotation from X1 to E1 about the positive X3 direction and a positive αDT defined by a counter-clockwise rotation from X1 to E1 about the positive X3 direction (Figure 1D).
The two local sheet angles (βDT and β′DT) were measured using the angle subtended by E2 and the local X3 (βDT) and the angle subtended by E3 and the local X3 (β′DT) using Equation [1] replacing X1 with X3 and replacing E1 with E2 and E3 respectively. βDT or β′DT was negative if the angle was defined by a counterclockwise rotation from X3 to E2 or E3 when viewing the positive X3-axis pointing from right to left (endocardium on the right) and positive if the angle was defined by a clockwise rotation from X3 to E2 or E3 when viewing the positive X3-axis pointing from right to left (Figure 1E). The sheet angles were defined within the interval of [−90°, +90°]. αDT, βDT and β′DT were calculated within every myocardial voxel throughout the myocardium.
Histological preparation and image processing
Subsequent to DTMRI the sheep hearts were prepared for histological measurement using the method of Harrington et al. (7) and Ennis et al. (22), which is briefly summarized herein. From each heart, two transmural blocks of tissue approximately 1 cm in length along the X2 (longitudinal direction pointing from the apex toward the base and through the aorto-mitral meatus) and X1 (circumferential direction perpendicular to X2 in the epicardial tangent plane) directions were excised – one from the antero-basal wall and the other from the lateral-equatorial wall immediately adjacent to the regions wherein the sets of tantalum markers were implanted (19).
Each transmural block of tissue was sliced into 1 mm-thick transmural sections parallel to the X1-X2 plane using a set of parallel ganged razor blades. This provided a series of 6–9 slices from epicardium to endocardium depending on the wall thickness at each heart’s ANT or LAT region. The transmural depth, measured in percent wall depth (WD), of each slice was determined by the number of slices obtained from each tissue block. Measurements were made from the epicardial aspect of each section and the first slice of each block defined the 0% WD corresponding to the epicardium. The WD for the Nth slice for a block of tissue with a total of M slices was defined as: %WD=100(N-1/M).
Each transmural slice was placed on a note card and affixed using cyanoacrylate, with the positive X1-axis coinciding with the horizontal edge of the slice and pointing to the right, positive X2-axis coinciding with the vertical edge of the slice and pointing up and positive X3 facing out of the note card towards the observer (Figure 3A). The resulting transmural samples were digitally photographed in this orientation to ensure a consistent local coordinate system for each measurement of histological fiber angle.
Figure 3.
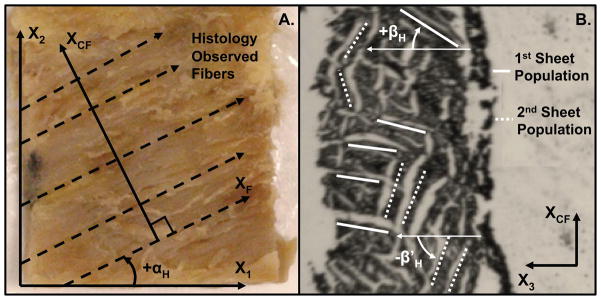
(A) Histological photo of observed fibers and depiction of histological fiber angle (αH) measured between local X1 and XF. Each dashed vector is a representative measure made by the observer. The local X2 and XCF axes are also shown. The local X3 direction (not shown) points out of the page toward the observer. (B) Histological photo of two observable sheet populations and depiction of histological sheet angles (βH and β′H) measured with respect to the local X3 direction. The local XCF also shown, XF (not shown) points out of the page toward the observer.
The same local coordinate system used to measure DTMRI angles was used to make histological measurements. A local fiber axis (XF) defined by the observed fiber direction within a transmural tissue section and a local cross fiber axis (XCF) defined by the direction normal to XF within the tissue section were also identified to facilitate histological measurement (Figures 1B and 3A). Using custom image-processing software written in Matlab, the local X1 direction was identified from the bottom edge of the tissue block, then five or more vectors evenly distributed across the image and oriented along the local myofiber axis (XF) were drawn (Figures 1B and 3A). A single XCF was manually identified in each photo as the vector normal to the average of the drawn XF vectors. The histological myofiber angle (αH) within each transmural section was defined by the average angle subtended by the drawn XF vectors and the local X1 within each digital image (Figures 1B and 3A). Fiber angles were defined on the interval of [−90°, +90°] with a negative αH defined by a clockwise rotation from X1 to the observed XF about the positive X3 direction and a positive αH defined by a counterclockwise rotation about the positive X3 direction.
After photographing each transmural tissue section, the section was cut along the cross-fiber axis (XCF) in the X1-X2 plane for direct visualization of the myolaminar sheets (Figures 1B-C and 3). This resulted in a 2–3 mm wide (in the XCF direction) strip of 1 mm thick (in the X3 direction) tissue bound to the note card. The note card was bent perpendicular to the plane of the tissue, placed in a shallow plastic mold (Tissue-Tek, Cryomold Intermediate, Miles, Elkhart, IN), filled with Optimal Cutting Temperature (OCT) compound (Tissue-Tek, Sakura Finetek, Torrance, CA), and frozen at −80°C for later microscopic evaluation of the sheet angles. At the time of microscopic evaluation the OCT embedded tissue was cut into 8–10 μm thick sections (1–3 sections per transmural tissue sample) with a microtome, transferred to a glass slide, and photographed at 25x using a microscope with an attached digital camera (Figure 3B). Every histological digital image had the same orientation of the positive X3-axis (pointing right-to-left) and the XCF-axis (pointing bottom-to-top) and captured a 1 mm wide (along X3) by 10 mm tall (along XCF)section of tissue (Figure 4). This assured similarity in tissue sample size for the determination of local sheet orientation between histological (1 mm × 10 mm samples from photos) and DTMRI (1 mm × 1 mm × 3 mm voxel resolution) measurements of sheet orientation. In our experience the tissue volume that was observed in histology was sufficiently large enough, such that any increase in size would not have changed the histological grade for the sample being observed.
Figure 4.
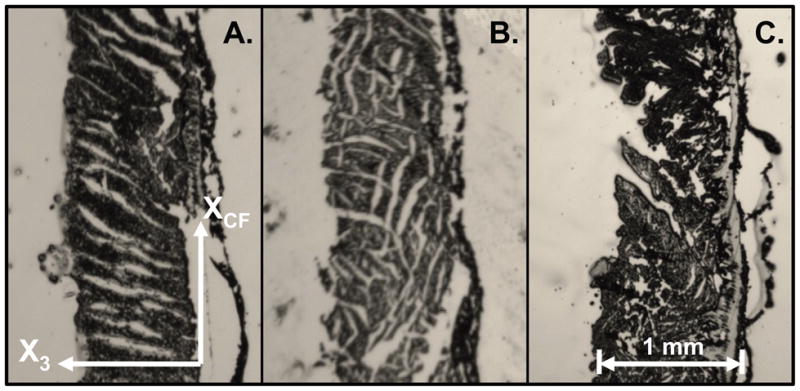
Histological photos of frozen microtome-cut sections showing sheet orientations perpendicular to fiber axis from representative samples of a range of appearances. (A) Corresponds to histology grade-1 (one distinct population of sheets); (B) corresponds to histology grade-2 (two distinct populations of sheets); (C) corresponds to histology grade-0 (no quantifiable sheet orientation).
One or two histologically observed myolaminar sheet population angles (βH and β′H) were determined from the observable cleavage planes within the microtome tissue sections. The observable cleavage planes are gaps between myolaminar sheets that run in the same direction as the sheets that surround them (7). βH was defined as the average angle subtended by the most dominant set of observable cleavage planes and X3 from all the microtome sections per transmural site (Figure 3B). To ensure βH is characteristic of each histological site, five cleavage planes evenly distributed throughout the image were measured and averaged to produce the βH measurement. Whenever possible, β′H was defined as the average angle subtended by a second set of five evenly distributed observable cleavage planes and X3 (Figure 3B). The requirement for making a β′H measurement was observing at least 5 cleavage planes in an obviously different direction than βH. The sheet angles were defined within the interval of [−90°, +90°]. βH or β′H was negative if the angle was defined by a counterclockwise rotation from X3 to the cleavage plane about XF and positive if the angle was defined by a clockwise rotation from X3 to the cleavage plane about XF.
If only βH was observed at a transmural site for a given microtome-cut section, that location was given a histology grade-1. If both βH and β′H were observed, then that location was given a histology grade-2. If no discernable sheet population was observable, then no measurement was recorded at that transmural site and the location was given a histology grade-0. Examples of each histological grade are depicted in Figure 4.
If separate microtome sections from the same transmural site of the same heart showed inconsistencies between histology grades, then precedence was given to the microtome section(s) with the highest grade and the other(s) was unused for measurement (Figure 5).
Figure 5.
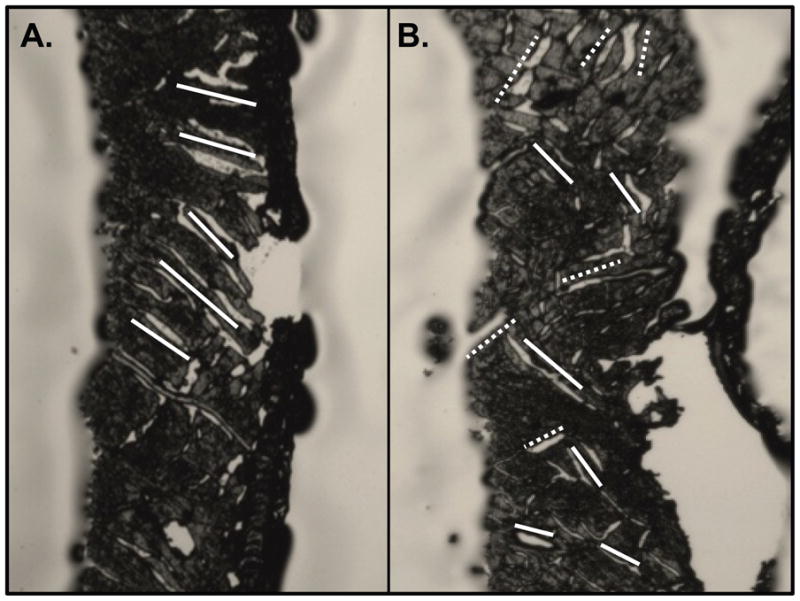
Histological photos of two microtome-cut frozen sections in the same transmural region of the same heart yielding (A) grade-1 and (B) grade-2 scores exhibiting the inconsistencies of histology measurements within the same histological site. In this specific case, the microtome section with the higher grade (B) was used for measurement and the lower grade microtome section (A) was unused.
Registering DTMRI and histological measurements
In order to register DTMRI and histology measurements, the axial slices selected for ANT and LAT DTMRI measurements were chosen from the slice wherein the ANT and LAT tantalum markers were visible as small susceptibility voids. Regions of interest (ROIs) were created in the short axis DTMRI images defined by two radial lines that spanned the entire transmural myocardial section; the signals from the tantalum markers were visible points along the edge of the ROI. The epicardial and endocardial boundaries served as the other two borders of the ROI. Within an ROI, all αDT’s from DTMRI voxels within ±5%WD of the corresponding histological WD were averaged to yield a single αDT estimate corresponding to each transmural site measured by histology. The same method was used to yield a single βDT and β′DT estimate at each transmural site corresponding to histology. %WD from epicardium-to-endocardium was measured at every voxel in the ROI by calculating the distance from the voxel of interest to the nearest epicardial voxel, then dividing that distance by the total distance between the nearest epicardial and nearest endocardial voxels. Therefore, 0%WD corresponds to the epicardium and 100%WD to the endocardium. A total of N=80 estimates of αDT, βDT, and β′DT were gathered corresponding to the 80 transmural sections of tissue obtained from histology.
This method established a one-to-one correspondence of αDT to αH. An apparent difference between αDT and αH may arise because αDT is a direct measure of the angle between E1(=XF) and X1, while αH is a measure of the apparent projection of the fibers (XF) onto the X1-X2 plane. Therefore, we measured the angle difference between these two possible measures of myofiber angle in the DTMRI data to account for this possible error.
For sites with a histological grade-2 score, βDT and β′DT were matched to βH and β′H. There exists, however, two possible pairings between DTMRI and histological data in grade-2 cases: βDT ↔ βH and β′DT ↔ β′H or β′DT ↔ βH and βDT ↔ β′H. βDT and β′DT are naturally rank ordered by their corresponding eigenvalues, but βH and β′H cannot be similarly, objectively ranked. The correspondence between βDT and β′DT to βH and β′H was, therefore determined by which pairing yielded the minimum square root of the sum of the squares of the differences between histology and DTMRI pairings resulting in “best matches” defined by Equation [2].
| [2] |
Subsequently, the βH and β′H measurements were given an alternate designation based on the DTMRI correspondence. βH-E2 was designated to histological sheet angles that were paired with βDT (thus associating with E2) and βH-E3 was designated to histological sheet angles that were paired with β′DT (thus associating with E3).
In grade-1 cases, only βH was measured and β′H was undefined. βH was then matched with the DTMRI measure (βDT or β′DT) that yielded the smaller difference. Transmural sites yielding histology grade-0 were not evaluated for DTMRI-histology comparison due to ambiguity in histological measurements.
During the registration process, DTMRI sheet angle measurements may fall beyond the [−90°, 90°] range due to the phase-wrapping of DTMRI measurements. Phase-wrapping allows angles separated by 180° to represent the same sheet orientation since sheets are not vectors and do not have a lead direction. Histological sheet angle measurements were always confined to [−90°, 90°] but in cases where the differences between DTMRI and histology sheet angles exceed 90°, the differences can be reduced if βDT and β′DT are allowed to fall outside the [−90°, 90°] range.
Tensor invariants and eigenvalues within the ANT and LAT ROIs for each heart were given correspondence to a histologically defined %WD in the same manner as α and β registration to yield a single mean at each transmural wall depth for each invariant.
Statistical Analysis
Bland-Altman plots, including the measurement biases and 95% confidence intervals, were constructed to measure the agreement between αDT and αH as well as βDT and βH For myolaminar sheet orientations, additional Bland-Altman plots were constructed using the best match data for grade-1 histological sites and data for grade-2 sites. Mean differences were also calculated from the differences in the DTMRI and histology measured pairs. Results are reported as mean ± one standard deviation. We also quantified the mean variance of each of the αH, αDT, βH, βDT and β′DT measures within each transmural site in order to quantify the precision of those measurements.
A histogram was constructed to compare histologically measured and DTMRI measured sheet angles at grade-1 and grade-2 locations. Histograms differentiating grade-1 and grade-2 locations were also constructed to compare the tensor invariants and eigenvalues between the two grades. The invariant and eigenvalue measures were bootstrapped 1000 times with replacement and the 95% confidence intervals of the bootstrapped means of each parameter were compared for grade-1 and grade-2 data. Bootstrapping was used because of the generally non-Gaussian distribution of the data.
RESULTS
Histological Grade
A total of 80 transmural sections were obtained for histology from the ANT and LAT regions of six hearts (6–9 sections per region per heart). Two sections had indiscernible fiber directions leading to no measurement of αH and thus no measurement of βH or β′H, resulting in 78 corresponding estimates of αDT and αH. From these 78 transmural sites, 37 sites (47%) were scored histological grade-1 (only βH observed), 38 sites (49%) were grade-2 (βH and β′H observed) and 3 sites (4%) were grade-0.
Myofiber Angle (αDT versus αH)
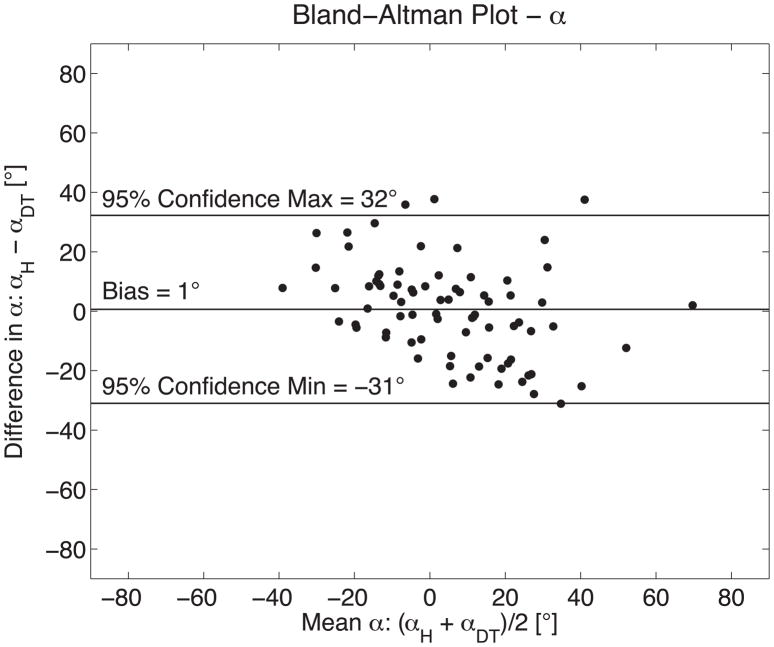
A paired comparison of αDT and αH (N=78 sites) yielded a mean difference and standard deviation of 1°±16°, which represents the systematic error between registering the two measures (Figure 6). Myofiber angle means had a mean SD of 6°±5° for histological measurements and 7°±8° for DTMRI measurements. Additionally, the average angle difference between αDT measured from E1 and X1 and the angle measured from the projection of E1 onto the X1-X2 plane and X1 was 1°±10° for all myocardial voxels within the ROIs used in DTMRI measurements.
Figure 6.
The measurement agreement between histology (αH) and DTMRI (αDT) derived measures of fiber orientation is demonstrated with a Bland-Altman plot comparing seventy-eight measures of fiber orientation in six sheep hearts. Histology measures were positively biased by 1° with 95% confidence intervals of +32°/−31°. These results are in excellent agreement with previously reported comparisons of histologic and DTMRI methods for quantifying fiber orientation (14,15).
Myolaminar Sheet Angles (βH and β′H versus βDT and β′DT)
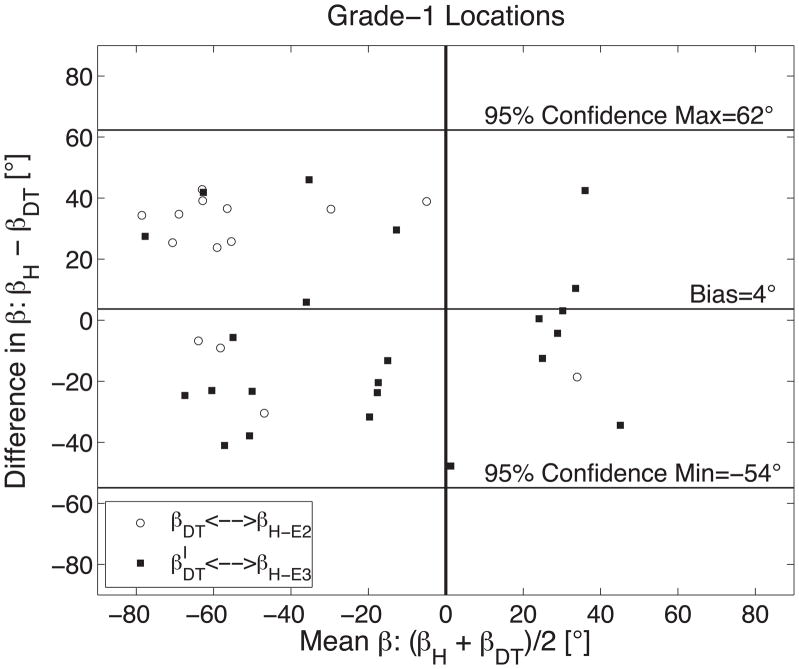
In the 37 histology grade-1 cases, themean difference between βH and βDT or β′DT was 4°±29° (Figure 7A). βDT was the best match in 14 cases (38%) resulting in a βH-E2-βDT mean difference of 20°±25° and β′DT was the best match in 23 cases (64%) resulting in a βH-E3-β′DT mean difference of −6°±27°.
Figure 7.
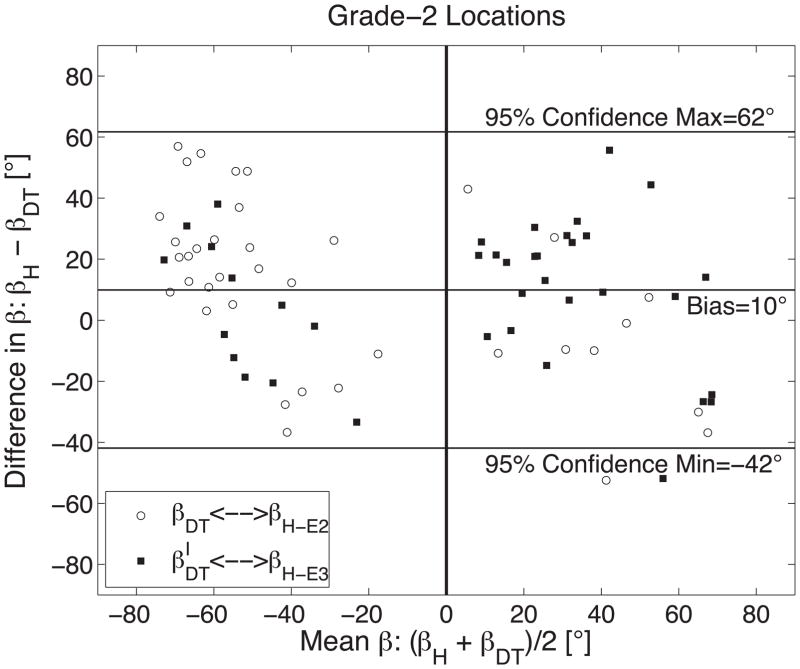
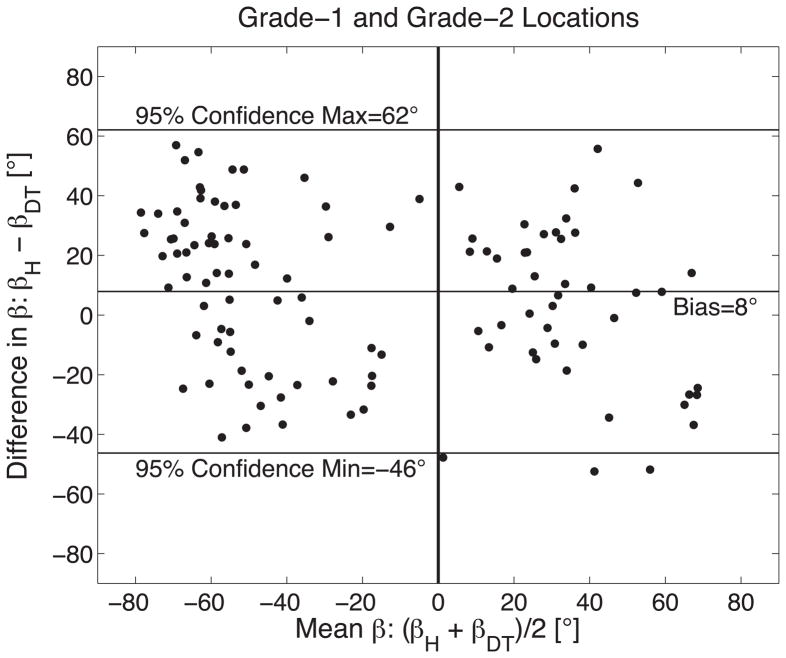
The measurement agreement between histology (βH) and DTMRI (βDT) derived measures of sheet orientation is demonstrated with a Bland-Altman plot comparing 75 measures of sheet orientation in six sheep hearts when (A) histology yielded a grade-1 results (N=37); (B) histology yielded grade-2 results (N=76); and (C) grade-1 and grade-2 results combined. Results in (A) and (B) are grouped into pairings that correspond to E2 (βDT and its histological best match) and E3 (β′DT and its best histological match). A vertical line is shown at (βH + βDT)/2=0 to emphasize the tendency for β-groups to be predominantly clustered into negative and positive groups.
βH and β′H were recorded at the 38 grade-2 histological sites leading to 76 “best matches” of DTMRI sheet angles (βDT or β′DT) to histological sheet angles (βH and β′H). When using the best match of pairings between both DTMRI measures (βDT and β′DT) and both histology measures (βH and β′H) at these sites, the mean difference and standard deviation was 10°±26° and is summarized in Figure 7B. The mean difference between βDT ↔ βH-E2 was 11°±29° and between β′DT ↔ βH-E3 was 8°±24°.
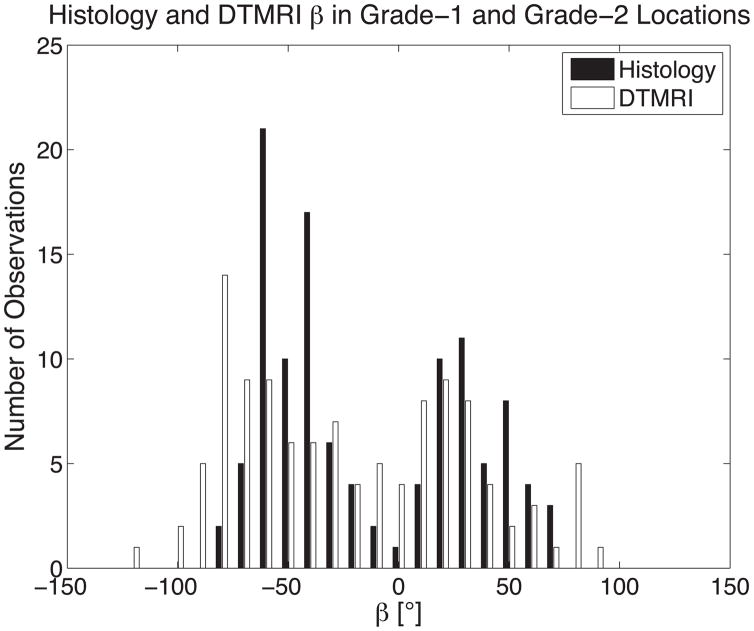
Combining all myolaminae orientation measurements (βH, β′H, βDT and β′DT) from both grade-1 and grade-2 cases yields a mean difference between DTMRI and histology measures of 8°±27° (Figure 7C) and demonstrates a distinct bimodal distribution of distinctly positive and distinctly negative sheet angles as depicted in a histogram of all sheet angles in Figure 8A. Table 1 summarizes the results when grouping sheet angles from grade-1 and grade-2 sites into positive and negative groups. The differences in positive and negative sheet angle means are 84° for histology and 91° for DTMRI.
Figure 8.
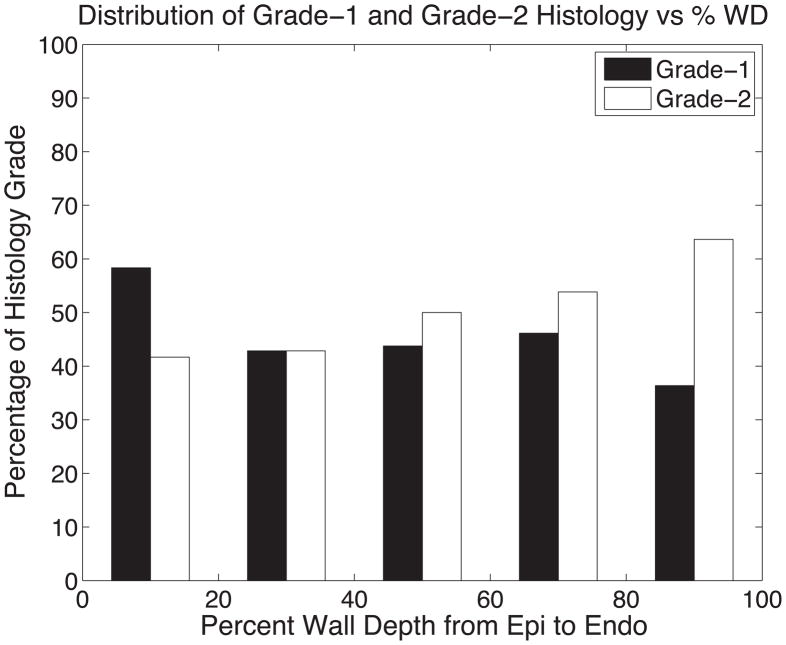
(A) The histogram of all histologically measured sheet angles (black) and DTMRI measured sheet angles (white) at histological grade-1 and grade-2 sites combined shows the bimodal nature of myolaminar orientation. The means of grouping sheet angles into negative and positive groups for DTMRI and histology measurements is summarized in Table 1. (B) The percentage of occurrences of grade-1 and grade-2 histology versus percent wall depth in 20% increments depicting an even distribution of both grades regardless of transmural location.
Table 1.
Mean histology and DTMRI measured and combined sheet angles differentiated by positive and negative sheet angle value
| Histology | DTMRI | |
|---|---|---|
| +β Mean | 36°±18° | 36°±24° |
| −β Mean | −48°±16° | −55°±28° |
The spatial distribution of grade-1 and grade-2 histology shows no preference of either grade as a function of percent wall depth as depicted in 20% WD increments in Figure 8B. The largest discrepancy of grade difference occurs in the 80–100% WD range in which grade-1 is observed in 36% of histology cases while grade-2 is observed in 64% of histology cases.
We examined the variances of the myolaminae orientation means at each transmural site in order to observe the precision of those measurements. Myolaminar sheet angle means had a mean SD of 11°±4° for histological measurements and 21°±22° for βDT and a mean SD of 24°±24° for β′DT.
Diffusion Tensor Invariants and Eigenvalues
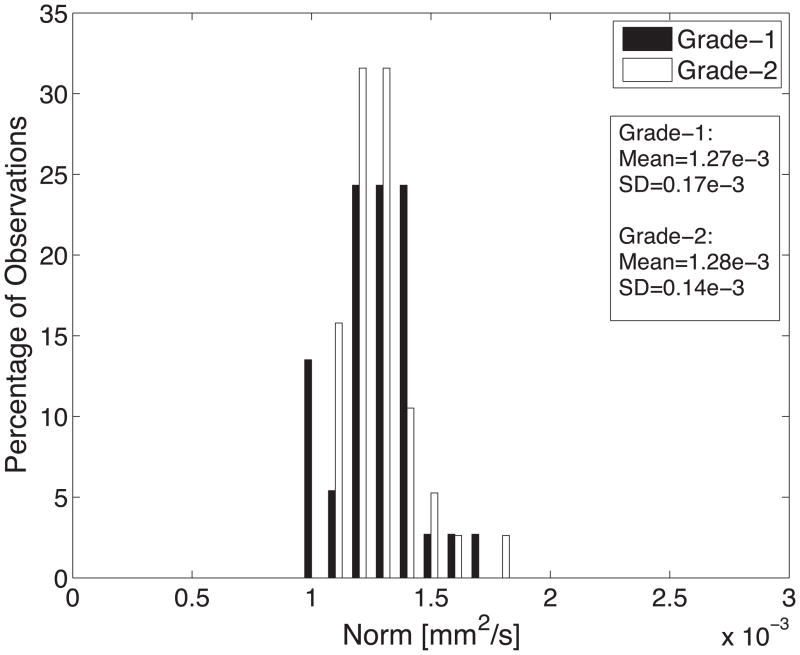
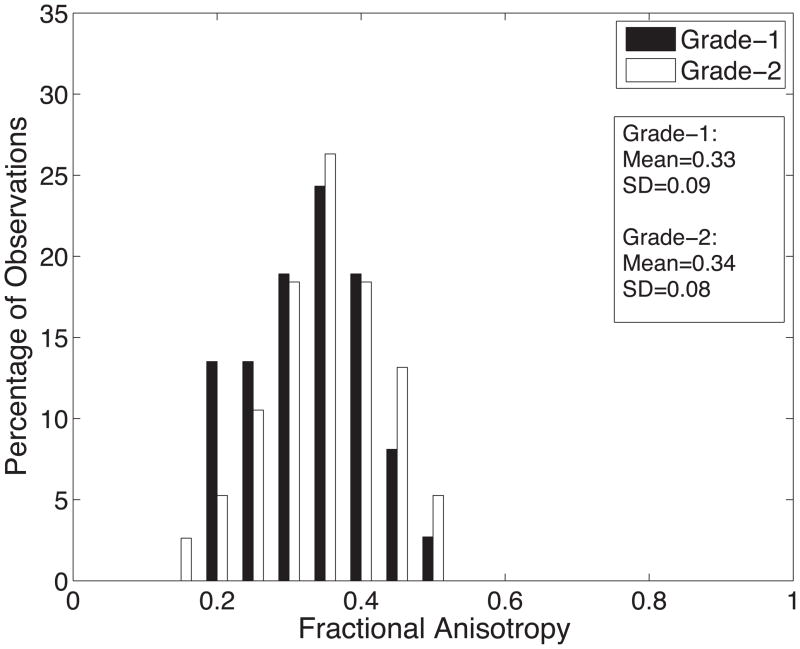
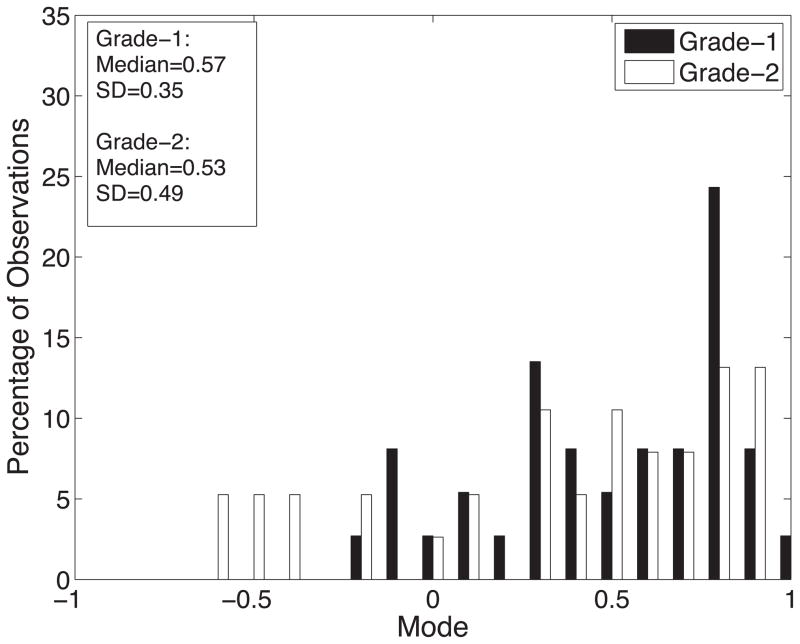
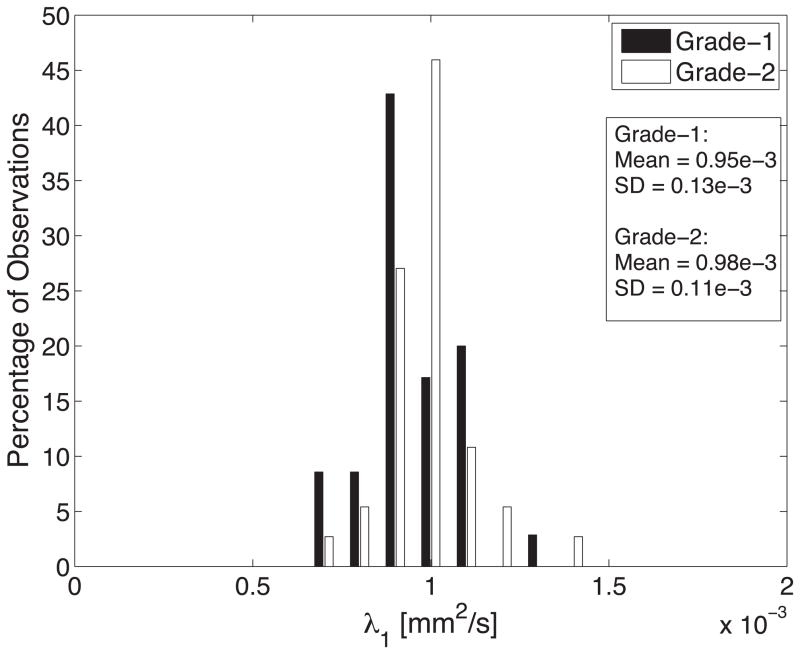
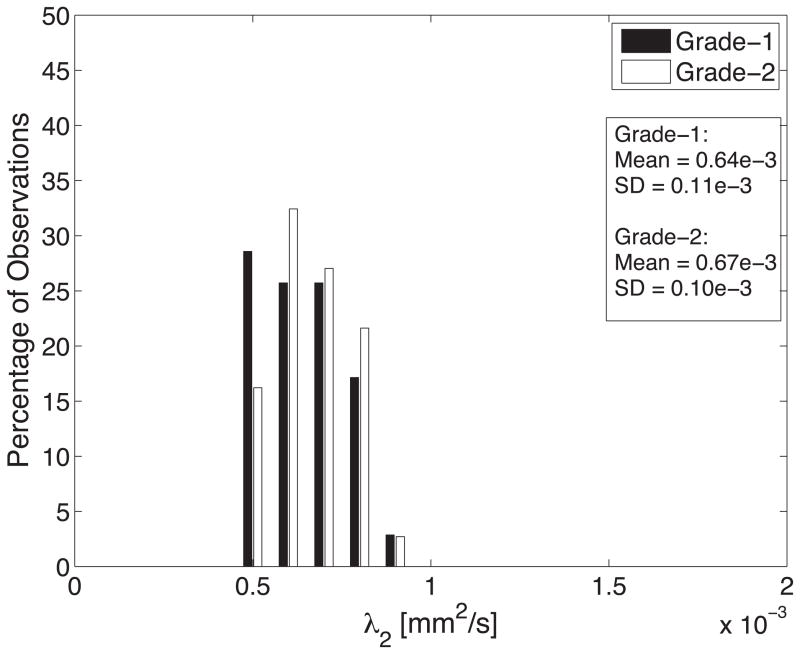
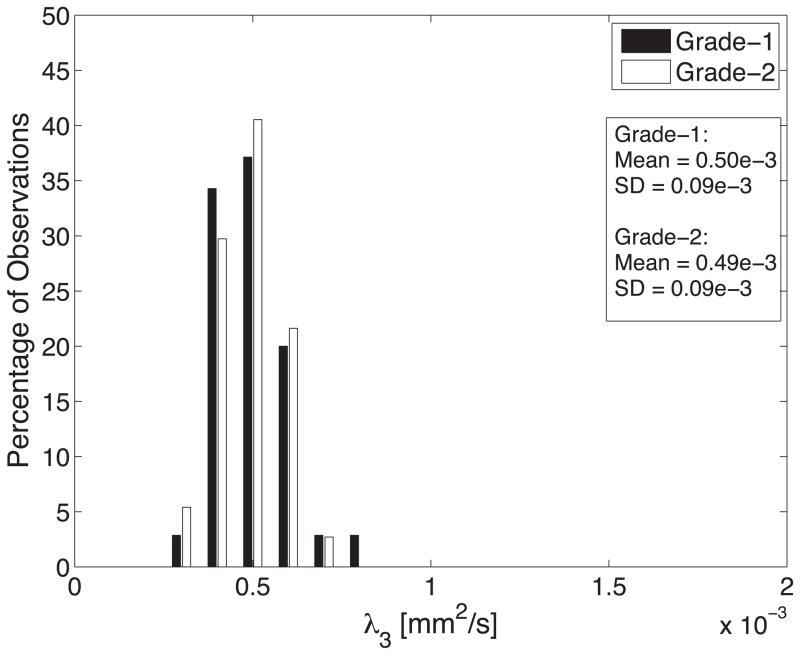
Diffusion tensor invariant and eigenvalue means corresponding to histological transmural sites show no significant differences when comparing grade-1 sites with grade-2 sites for ANT and LAT regions of all hearts (Figure 9). The overall means for tensor norm, FA and eigenvalues and the median tensor mode for all transmural sites and 95% confidence intervals for the bootstrapped statistic are summarized in Table 2. The median of tensor mode for all sites was used rather than the mean due to its non-normal distribution. Overlaps in the bootstrapped 95% confidence interval between grade-1 and grade-2 tensor invariant and eigenvalue data indicate no statistically significant differences in the underlying microstructural diffusive properties between grade-1 and grade-2 histological sites. Additionally, the lack of overlap between 95% confidence intervals for grade-1 between λ2 and λ3 and for grade-2 between λ2 and λ3 indicates a significant difference between λ2 and λ3 for both grades.
Figure 9.
Histograms of diffusion tensor invariants that describe the (A) magnitude of isotropy (tensor norm); (B) the magnitude of anisotropy (fractional anisotropy); (C) the kind of anisotropy (tensor mode); (D) λ1; (E) λ2; and (F) λ3 for tissue sections with histological grade-1 (black) or grade-2 (white) scores. There were no statistical differences between the grade-1 and grade-2 tensor invariants or eigenvalues indicating that the diffusive microstructure of the tissue is not significantly different, despite a different appearance with histology.
Table 2.
Tensor invariant and eigenvalue data at grade-1 and grade-2 histological locations. The means ± one standard deviation (norm and FA) and median ± one standard deviation (mode) are listed as well as the 95% confidence interval for the means (norm, FA and eigenvalues) and median (mode) drawn from 1000 iterations of bootstrapping. Median was used for tensor mode statistics due to its non-normal distribution
| Parameter | Mean or Median ± SD | Bootstrapped 95% CI | ||
|---|---|---|---|---|
| Grade-1 | Grade-2 | Grade-1 | Grade-2 | |
| Norm (mm2/s) | 1.27e-3±0.17e-3 | 1.28e-3±0.14e-3 | [1.22e-3;1.32e-3] | [1.24e-3;1.33e-3] |
| FA | 0.33±0.09 | 0.34±0.08 | [0.30;0.36] | [0.32;0.37] |
| Mode | 0.57±0.35 | 0.53±0.49 | [0.35;0.78] | [0.27;0.66] |
| λ1 (mm2/s) | 0.95e-3±0.13e-3 | 0.98e-3±0.11e-3 | [0.92e-3;0.10e-3] | [0.95e-3;0.10e-3] |
| λ2 (mm2/s) | 0.64e-3±0.11e-3 | 0.67e-3±0.10e-3 | [0.61e-3;0.68e-3] | [0.63e-3;0.70e-3] |
| λ3 (mm2/s) | 0.50e-3±0.09e-3 | 0.49e-3±0.09e-3 | [0.48e-3;0.53e-3] | [0.46e-3;0.51e-3] |
We also measured the standard deviations of the tensor invariants and eigenvalues for the voxels associated with each histologically defined transmural site in order to assess the variability of the measured data. The tensor norm, fractional anisotropy and tensor mode within each transmural site yielded mean SDs of 0.12e-3±0.09e-3 mm2/s, 0.05±0.02 and 0.26±0.17 respectively. λ1, λ2 and λ3 mean SDs of 0.09e-3±0.05e-3 mm2/s, 0.07e-3±0.05e-3 mm2/s and 0.07e-3±0.05e-3 mm2/s respectively.
DISCUSSION
Myolaminae Orientation
Tseng et al. (17) are the only other group to have previously published a comparison of DTMRI eigenvectors and sheet orientations measured in tissue. However, in that study, only angle differences between E2 and a single local cleavage plane orientation from inked prints of cut faces in short axis, long axis and parallel to the epicardial tangent plane directions were measured. They did not report sheet orientation or sheet angle relative to any coordinate system. Thus, this study is the first to make a direct comparison of local sheet angles between histological and DTMRI measurements.
Note that while the difference between means of positive and negative DT measured sheet angles is 91° as expected from measures derived from orthogonal eigenvectors, the difference between the means of positive and negative histology measured sheet angles is 84° for which there is no constraint. This supports the idea that the two sheet populations are nearly orthogonal in the end diastolic state. This bimodal and orthogonal distribution of myolaminae orientations observed in both DTMRI and histology also compares well to previous studies wherein measured sheet orientation angles tend to cluster around a +45° range and a −45° range (7,10–12). Helm et al. (11,12) used tertiary eigenvectors to define the sheet normal orientation and identified dominant myolaminae orientations at +45° and −63° in canine LVs. Harrington et al. (7) observed histologically measured myolaminae sheet orientations belonging to +45° near epicardial and endocardial regions and −45° in the midwall in ovine LVs. Pope et al. (8) also observed two orthogonal local myolaminae orientations in the rat LV using confocal microscopy. Finally, Hooks et al. (6) histologically observed dominant negative sheet populations with small “pockets” of orthogonal positive sheet orientations in porcine LVs. Our work further confirms the presence of two sheet populations in myocardium.
The even distribution of histology grade as a function of percent wall depth implies no preference of one or two observable sheet populations based on transmural location. Myocardial sheets permit faster diffusion along the sheet direction (E2) direction than the sheet normal direction (E3) and slower than the fiber direction (E1 or XF). This has the consequence of leading to significant differences in diffusivity between λ1, λ2, and λ3 such that λ1 > λ2 > λ3. In the case of myocardium with two sheet populations that are orthogonal (or nearly so), the expectation would be that λ2 (grade-1) > λ2 (grade-2) and λ3 (grade-1) < λ3 (grade-2) because there would exist an additional path for the free diffusion of water along the E3 direction and additional barriers along the E2 direction. This increase in λ2 and decrease in λ3 for the grade-1 tissue relative to grade-2 tissue would cause tensor norm to increase (more freely diffusive), FA to increase (more anisotropic), and tensor mode to decrease (more planar anisotropic). However, there were no statistically significant differences between tensor invariants or eigenvalues in the grade-1 and grade-2 data, which indicate that the underlying microstructural diffusive properties of the tissue are very similar. There was, however, a significant difference between λ2 and λ3, which indicates significantly unequal diffusivities in the E2 and E3 directions. It is possible that histological sections wherein only one-sheet population is evident actually contain two sheet populations, but the second population is not always visible under histological examination. This is supported by inconsistent histology grades within multiple microtome-cut slices of the same transmural site, which was observed in 10 of the 59 (17%) transmural locations where multiple microtome cut sections were examined for myolaminae orientation by histology. Furthermore, in five transmural sites (8%), histology was scored grade-1 in one microtome-cut section and grade-2 in another microtome-cut section (Figure 5). The cause of this phenomenon is not yet known. One possible explanation could arise from subtle differences in the microtome processing that result in cleavage planes from one particular sheet population opening more easily than cleavage planes from the other sheet population. This problem is avoided in DTMRI as sheet orientation can be non-destructively evaluated on whole hearts without any histological preparation (cutting, slicing, freezing, sectioning, etc.).
Previous studies have explained the function of myolaminar sheets in cardiac mechanics. Legrice et al. (3,4) explain interlaminar transverse shear of adjacent myolaminar sheets along their cleavage planes as the main mechanism of systolic wall thickening. Arts et al. (10) hypothesize that two sheet orientations do not occur simultaneously at a given transmural location but rather in patches and suggests that shear would split the tissue if both populations occurred in the same local region. This may be consistent with our findings as our imaging resolution is well above the size of the individual myolaminae. Harrington et al. (7) expands on transverse shear mechanics using their results of positive sheet populations in epicardial and endocardial regions and negative sheet populations in midwall regions to explain “accordion-like” systolic wall thickening. In their model, interlaminar transverse shear would alternate directions transmurally and minimize shear displacement of the epicardium relative to the endocardium. This “accordion-like” wall thickening mechanism can also apply to our more locally refined positive and negative sheet orientations. However, instead of alternating shear displacements from epicardium to midwall to endocardium; our model suggests locally alternating shear displacements at every transmural location in accordance to the two distinct sheet populations occurring throughout the entire LV myocardium.
Limitations with Myolaminae Orientation
This study assumes that E2 and E3 lie in the XCF-X3 plane thus allowing for an accurate correspondence to histological measurements, which is reasonable given the excellent agreement between αDT (derived from E1) and αH. If E2 and E3 do not lie in the XCF-X3, βDT and β′DT would not directly correspond to the angles subtended by the cleavage planes observed in histology and the local X3 axis within XCF-X3 plane. Instead, the βDT and β′DT measurements would correspond to the projection of cleavage planes onto the E2-E3 plane. This is not a significant limitation if the difference in βDT and β′DT is close to 90° meaning E2 and E3 lie close to the XCF-X3 plane and the 91° difference in the means of negative and positive DT measured sheet angles as reported earlier certainly supports this. Additionally, the small angle difference of 1°±10° between angles subtended by E1 and X1 and angles subtended by the projection of E1 onto the X1-X2 plane and X1 indicates that E1 lies nearly on the X1-X2 plane at the observed locations. Because E1 is normal to the E2-E3 plane and XF is normal to the XCF-X3 plane, it is safe to assume that E2 and E3 do lie nearly in the XCF-X3 plane.
This study uses the mean of all DTMRI measured myolaminae orientations from voxels within a specific transmural wall depth range of a specific ROI and correlates them to a single histological site, but does not account for the variance of sheet angles within these voxels. If voxels have a high variance within a specific region, then representing that region with a single estimate may not be effective in comparison to the mean of the corresponding histologically obtained sheet angle. This was not an issue within histology as variance of histological measurements within a particular histological site was small and did not yield a standard deviation over 25°. However, βDT estimates yielded a mean SD of 21°±22° and β′DT estimates yielded a mean SD of 24°±24°. Further improvements in SNR and spatial resolution should reduce the SDs. The only tensor invariant that showed a large SD within mean measurements at transmural sites was the tensor mode, which yielded a mean SD of 0.26±0.17. The DTMRI measured sheet angle and tensor mode means within these sites were still used for comparison to histological measures.
Our study compares histological and DTMRI measurements in ANT and LAT regions of the LV and from these observations we infer that two local sheet populations may exist throughout the entire myocardium. Without performing a more extensive study of the entire myocardium we cannot prove the existence of two local sheet orientations at all myocardial locations. However, due to the tedious nature of taking histological measures, performing a whole heart histological study of fiber and sheet orientations is infeasible with current techniques.
The observer’s subjectivity could change the mean or the variance in βH. A change in the variance (assuming a symmetric distribution) will not have a significant effect because only the mean βH is used for subsequent analysis. An increase in the mean βH, however, would increase the bias measurement between βH and βDT/β′DT. The subjectivity of the histological measurements may be reduced through the use of reliable, automated image processing methods, which may further improve the agreement between histological and DTMRI data.
In conclusion we have shown DTMRI measurements using secondary and tertiary eigenvectors correspond to each of the two local myolaminar sheet orientations observed in histology. Additionally, we have shown that two local sheet populations may exist throughout the LV myocardium and the histological observation of only one local sheet population may be due to preparation artifact.
Acknowledgments
Grant Support: The authors gratefully acknowledge research support from NIH/NHLBI Grants R01 HL-29589 and R01 HL-67025 (to D.C.M.) and K99-R00 HL-087614 (to D.B.E.).
The authors gratefully acknowledge research support from NIH/NHLBI Grants R01 HL-29589 and R01 HL-67025 (to D.C.M.) and K99-R00 HL-087614 (to D.B.E.).
References
- 1.Chen J, Liu W, Zhang H, et al. Regional ventricular wall thickening reflects changes in cardiac fiber and sheet structure during contraction: quantification with diffusion tensor MRI. Am J Physiol Heart Circ Physiol. 2005;289(5):H1898–1907. doi: 10.1152/ajpheart.00041.2005. [DOI] [PubMed] [Google Scholar]
- 2.Costa KD, Takayama Y, McCulloch AD, Covell JW. Laminar fiber architecture and three-dimensional systolic mechanics in canine ventricular myocardium. Am J Physiol. 1999;276(2 Pt 2):H595–607. doi: 10.1152/ajpheart.1999.276.2.H595. [DOI] [PubMed] [Google Scholar]
- 3.LeGrice IJ, Smaill BH, Chai LZ, Edgar SG, Gavin JB, Hunter PJ. Laminar structure of the heart: ventricular myocyte arrangement and connective tissue architecture in the dog. Am J Physiol. 1995;269(2 Pt 2):H571–582. doi: 10.1152/ajpheart.1995.269.2.H571. [DOI] [PubMed] [Google Scholar]
- 4.LeGrice IJ, Takayama Y, Covell JW. Transverse shear along myocardial cleavage planes provides a mechanism for normal systolic wall thickening. Circ Res. 1995;77(1):182–193. doi: 10.1161/01.res.77.1.182. [DOI] [PubMed] [Google Scholar]
- 5.Hooks DA. Myocardial segment-specific model generation for simulating the electrical action of the heart. Biomed Eng Online. 2007;6:21. doi: 10.1186/1475-925X-6-21. [DOI] [PMC free article] [PubMed] [Google Scholar]
- 6.Hooks DA, Trew ML, Caldwell BJ, Sands GB, LeGrice IJ, Smaill BH. Laminar arrangement of ventricular myocytes influences electrical behavior of the heart. Circ Res. 2007;101(10):e103–112. doi: 10.1161/CIRCRESAHA.107.161075. [DOI] [PubMed] [Google Scholar]
- 7.Harrington KB, Rodriguez F, Cheng A, et al. Direct measurement of transmural laminar architecture in the anterolateral wall of the ovine left ventricle: new implications for wall thickening mechanics. Am J Physiol Heart Circ Physiol. 2005;288(3):H1324–1330. doi: 10.1152/ajpheart.00813.2004. [DOI] [PMC free article] [PubMed] [Google Scholar]
- 8.Pope AJ, Sands GB, Smaill BH, LeGrice IJ. Three-dimensional transmural organization of perimysial collagen in the heart. Am J Physiol Heart Circ Physiol. 2008;295(3):H1243–H1252. doi: 10.1152/ajpheart.00484.2008. [DOI] [PMC free article] [PubMed] [Google Scholar]
- 9.Sands GB, Gerneke DA, Hooks DA, Green CR, Smaill BH, Legrice IJ. Automated imaging of extended tissue volumes using confocal microscopy. Microsc Res Tech. 2005;67(5):227–239. doi: 10.1002/jemt.20200. [DOI] [PubMed] [Google Scholar]
- 10.Arts T, Costa KD, Covell JW, McCulloch AD. Relating myocardial laminar architecture to shear strain and muscle fiber orientation. Am J Physiol Heart Circ Physiol. 2001;280(5):H2222–2229. doi: 10.1152/ajpheart.2001.280.5.H2222. [DOI] [PubMed] [Google Scholar]
- 11.Helm P, Beg MF, Miller MI, Winslow RL. Measuring and mapping cardiac fiber and laminar architecture using diffusion tensor MR imaging. Ann N Y Acad Sci. 2005;1047:296–307. doi: 10.1196/annals.1341.026. [DOI] [PubMed] [Google Scholar]
- 12.Helm PA, Tseng HJ, Younes L, McVeigh ER, Winslow RL. Ex vivo 3D diffusion tensor imaging and quantification of cardiac laminar structure. Magn Reson Med. 2005;54(4):850–859. doi: 10.1002/mrm.20622. [DOI] [PMC free article] [PubMed] [Google Scholar]
- 13.Holmes AA, Scollan DF, Winslow RL. Direct histological validation of diffusion tensor MRI in formaldehyde-fixed myocardium. Magn Reson Med. 2000;44(1):157–161. doi: 10.1002/1522-2594(200007)44:1<157::aid-mrm22>3.0.co;2-f. [DOI] [PubMed] [Google Scholar]
- 14.Hsu EW, Muzikant AL, Matulevicius SA, Penland RC, Henriquez CS. Magnetic resonance myocardial fiber-orientation mapping with direct histological correlation. Am J Physiol. 1998;274(5 Pt 2):H1627–1634. doi: 10.1152/ajpheart.1998.274.5.H1627. [DOI] [PubMed] [Google Scholar]
- 15.Scollan DF, Holmes A, Winslow R, Forder J. Histological validation of myocardial microstructure obtained from diffusion tensor magnetic resonance imaging. Am J Physiol. 1998;275(6 Pt 2):H2308–2318. doi: 10.1152/ajpheart.1998.275.6.H2308. [DOI] [PubMed] [Google Scholar]
- 16.Scollan DF, Holmes A, Zhang J, Winslow RL. Reconstruction of cardiac ventricular geometry and fiber orientation using magnetic resonance imaging. Ann Biomed Eng. 2000;28(8):934–944. doi: 10.1114/1.1312188. [DOI] [PMC free article] [PubMed] [Google Scholar]
- 17.Tseng WY, Wedeen VJ, Reese TG, Smith RN, Halpern EF. Diffusion tensor MRI of myocardial fibers and sheets: correspondence with visible cut-face texture. J Magn Reson Imaging. 2003;17(1):31–42. doi: 10.1002/jmri.10223. [DOI] [PubMed] [Google Scholar]
- 18.Ennis DB, Nguyen TC, Itoh A, et al. Reduced systolic torsion in chronic “pure” mitral regurgitation. Circ Cardiovasc Imaging. 2009;2(2):85–92. doi: 10.1161/CIRCIMAGING.108.785923. [DOI] [PMC free article] [PubMed] [Google Scholar]
- 19.Nguyen TC, Itoh A, Carlhall CJ, et al. The effect of pure mitral regurgitation on mitral annular geometry and three-dimensional saddle shape. J Thorac Cardiovasc Surg. 2008;136(3):557–565. doi: 10.1016/j.jtcvs.2007.12.087. [DOI] [PMC free article] [PubMed] [Google Scholar]
- 20.Skare S, Hedehus M, Moseley ME, Li TQ. Condition number as a measure of noise performance of diffusion tensor data acquisition schemes with MRI. J Magn Reson. 2000;147(2):340–352. doi: 10.1006/jmre.2000.2209. [DOI] [PubMed] [Google Scholar]
- 21.Ennis DB, Kindlmann G. Orthogonal tensor invariants and the analysis of diffusion tensor magnetic resonance images. Magn Reson Med. 2006;55(1):136–146. doi: 10.1002/mrm.20741. [DOI] [PubMed] [Google Scholar]
- 22.Ennis DB, Nguyen TC, Riboh JC, et al. Myofiber angle distributions in the ovine left ventricle do not conform to computationally optimized predictions. J Biomech. 2008;41(15):3219–3224. doi: 10.1016/j.jbiomech.2008.08. [DOI] [PMC free article] [PubMed] [Google Scholar]


