
Figure 2.
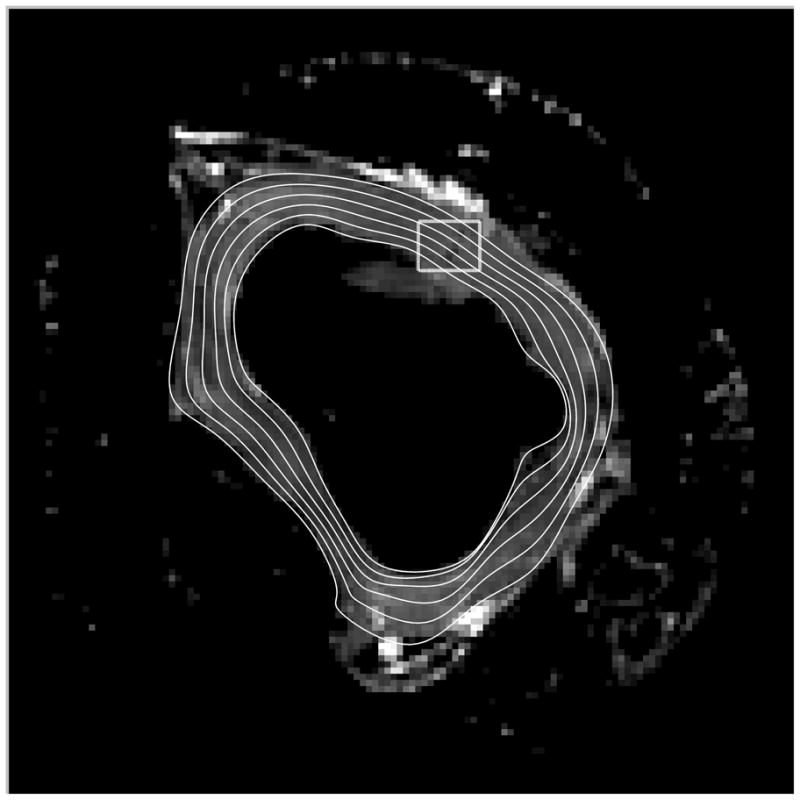

(A) Epicardial and endocardial contours (white) were derived from b-spline polynomials fitted to segmented images of individual LV short-axis slices and is shown overlaid on the corresponding non-diffusion weighted axial MR image. The intramural contours were derived by weighting the b-spline weights at each control point and these contours were subsequently used to define local circumferential (X1, gray) and radial (X3, black) vectors (B), which is a zoomed-in view from the box in (A).