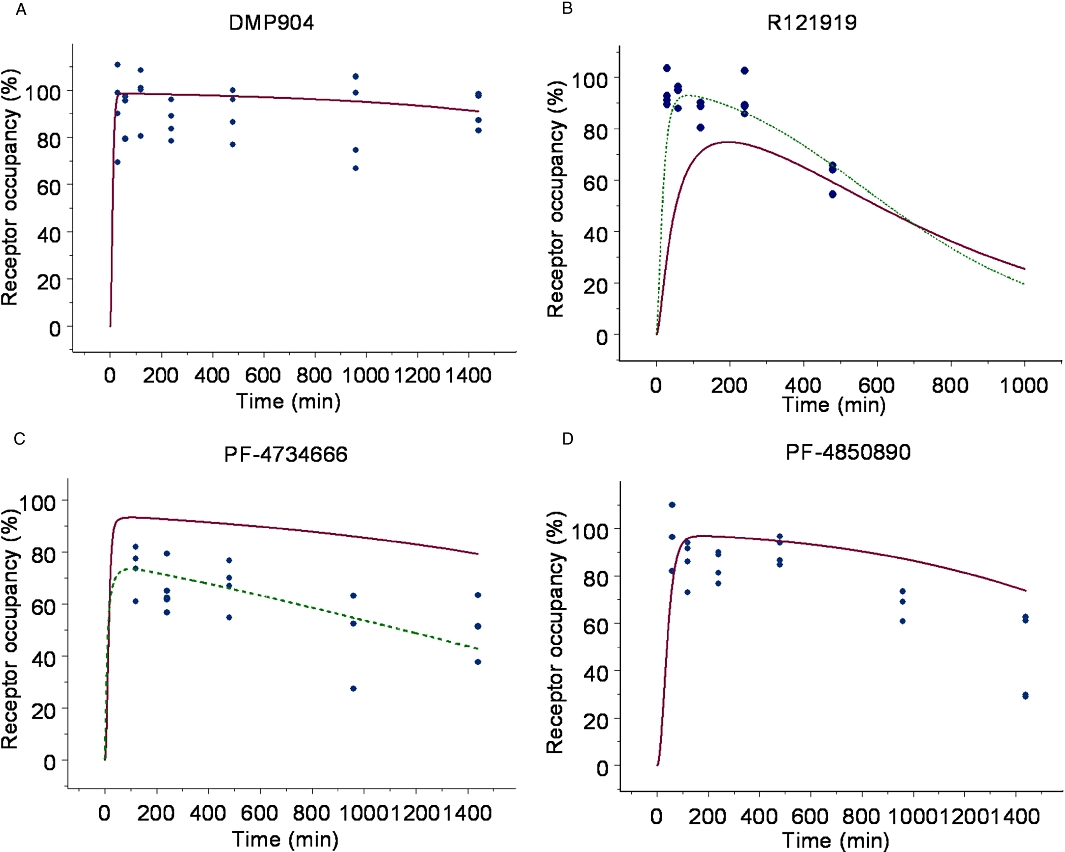
Figure 9.

Simulations of receptor occupancy versus time profiles using the in vitro non-equilibrium binding kinetic kon and koff values (solid line), or kon optimized fit (dashed line), superimposed on observed receptor occupancy data ( ). (A) DMP904, (B) R121919, (C) PF-4734666, (D) PF-4850890.
