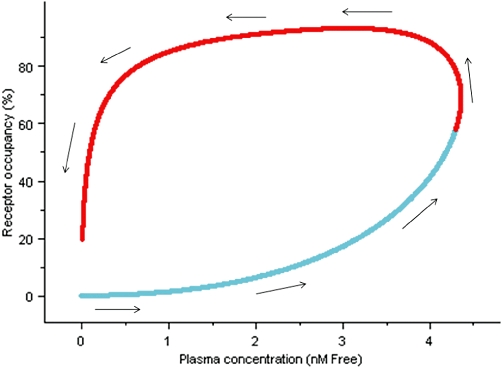
Figure 11.

Simulation of R121919 receptor occupancy versus concentration profile using rat pharmacokinetic parameters and kon and koff rates determined from in vitro non-equilibrium binding kinetic experiments. Arrows indicate the time order of concentration data, the light blue line represent concentration data not captured by in vivo receptor occupancy study and the red line represent concentration range covered with the in vivo study.
