
Figure 3.
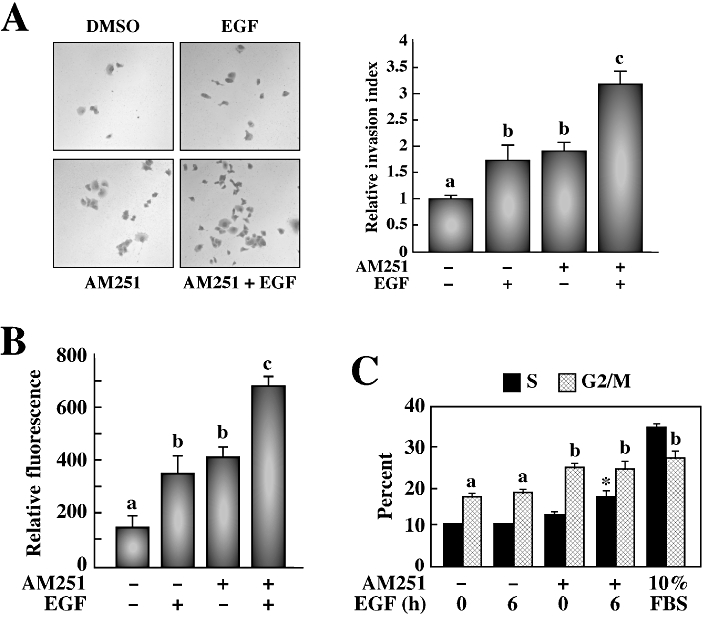
AM251 has enhancing effects on the response of EGF towards invasion, colony formation in soft agar and proliferation in PANC-1 cells. (A) Transwell migration chambers were used to determine invasive capacity of PANC-1 cells treated or not with AM251 (5 µM) for 24 h, followed by EGF (20 nM). After 72 h of invasion through matrigel, cells were stained with crystal violet, images were taken (left) and cells were counted (right). The data are representative of three independent experiments and is shown as the average ± SEM. Different letters (a, b, c) indicate significance of P < 0.05 among groups. (B) A soft agar colony formation assay was used to detect anchorage-independent growth of PANC-1 cells treated with AM251 for 24 h, followed by EGF (20 nM). After 7 days of growth in a semisolid agar media, cells were solubilized, lysed and detected by CyQuant GR Dye in a fluorescence plate reader. The histogram shows the relative fluorescence units from three independent experiments with a starting density of 0.5 × 10⁵ cells·mL−1. The data are shown as the average ± SEM. (C) Propidium iodide staining was used to determine DNA cell cycle analysis by flow cytometry. The columns represent the % of PANC-1 cells in the S and G2/M stages of the cell cycle after treatment with AM251 (5 µM) for 24 h and EGF (20 nM) for 6 h. Cells left untreated in complete media (10% FBS) were used as a control. The data represent the average ± SD (n = 3). Different letters (a, b) indicate significance of P < 0.01 among groups. *P < 0.001 versus AM251-treated cells.