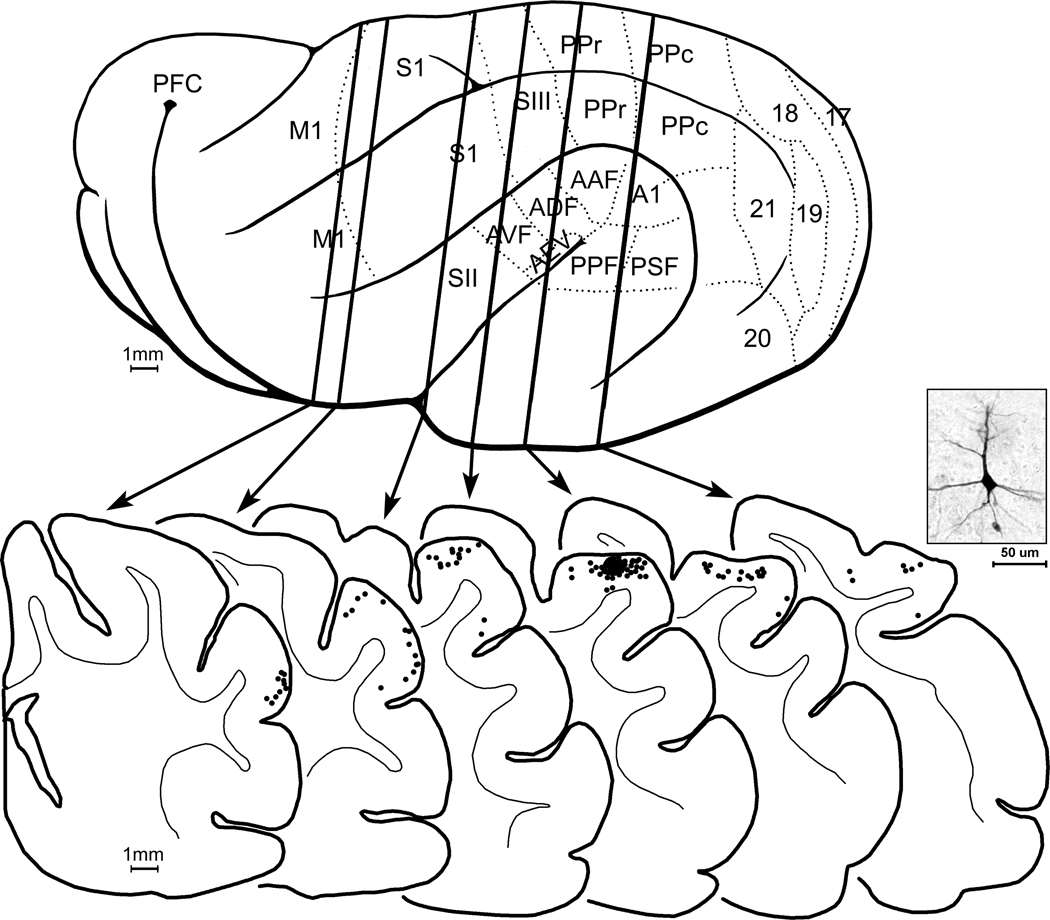
Figure 7.
Projections to SIII demonstrated with tracer (BDA) injection. In (A), the lateral view of the hemisphere shows the known functional subdivisions (dotted lines). Vertical lines passing through the brain (TOP) correspond to the coronal sections s below. At bottom, the coronal sections are arranged serially (anterior=left) with the grey-white border of the cortical mantle indicated (thin line). The tracer was injected (black area) into the representation of the superior vibrissa recorded at that site. Each retrogradely labeled neuron (as shown in the example photomicrograph) was marked with a single black dot. Retrogradely labeled neurons are present in SI, MRSS, M1, and PPr, indicating the connectivity of these areas with SIII.

