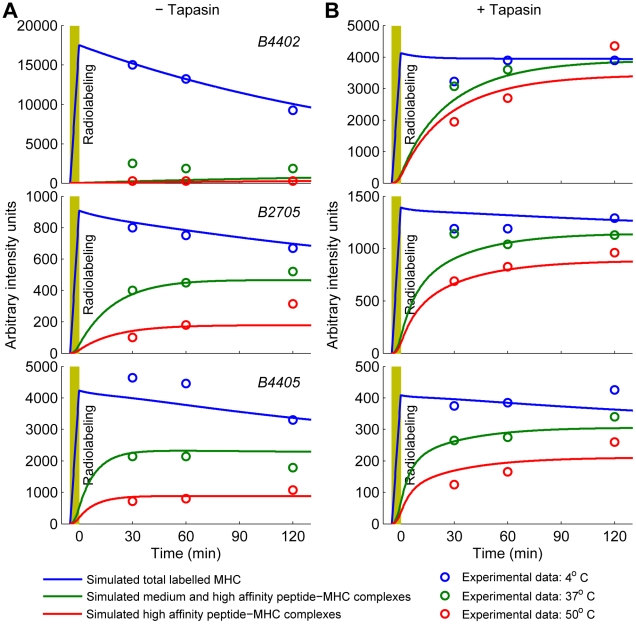
Figure 4. Simulation of time-dependent peptide optimization by HLA–B.
The peptide optimization model of Fig. 2 was used to simulate a labeled cohort of peptide-MHC complexes by switching from generation of an unlabeled MHC population to a labeled population for 5 min (yellow blocks). The plots represent the concentration of total labeled MHC (blue), labeled MHC with medium or high affinity peptide (green) and labeled MHC with high affinity peptide only (red), at each time point. Simulations were performed in the absence (A) and presence (B) of tapasin. Corresponding experimental results [6] are also reported (circles). Simulations were conducted for representative low, medium and high affinity peptides with a separate dissociation rate  and generation rate
  for each peptide
  , and a separate peptide binding rate
  for each HLA–B allele
  (Table S1 in Text S1; Protocol S1).

