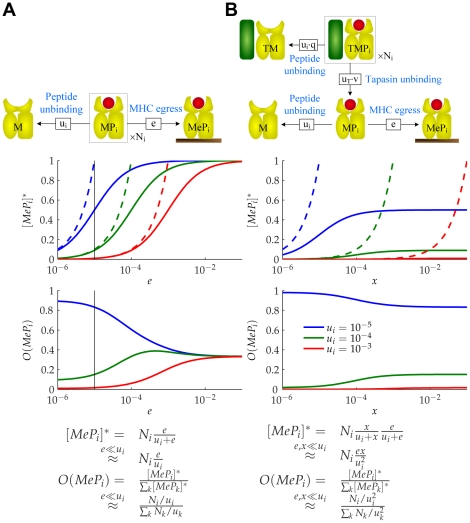
Figure 5. Filtering relation of MHC class I peptide optimization.
(A) Consider a population of  MHC complexes containing peptides with off-rate
  .
.  denotes the expected number of MHC complexes that will egress before the peptide can escape.
  denotes the expected proportion of egressed MHC complexes that will contain peptides with off-rate
  . This defines a measure of peptide optimization. We plot
  and
and  as functions of
  for three peptides with different off-rates and the same initial populations. Maximal optimization is achieved when
  , with
  (dashed lines). (B) Consider a population of
  tapasin-MHC complexes containing peptides with off-rate
  .
.  denotes the expected number of MHC complexes that will unbind from tapasin and egress before the peptide can escape, where
  .
.  is defined as in A. We plot
  and
and  as functions of
  with
with  (black line in A). Maximal optimization is achieved when
  , with
  .
.

