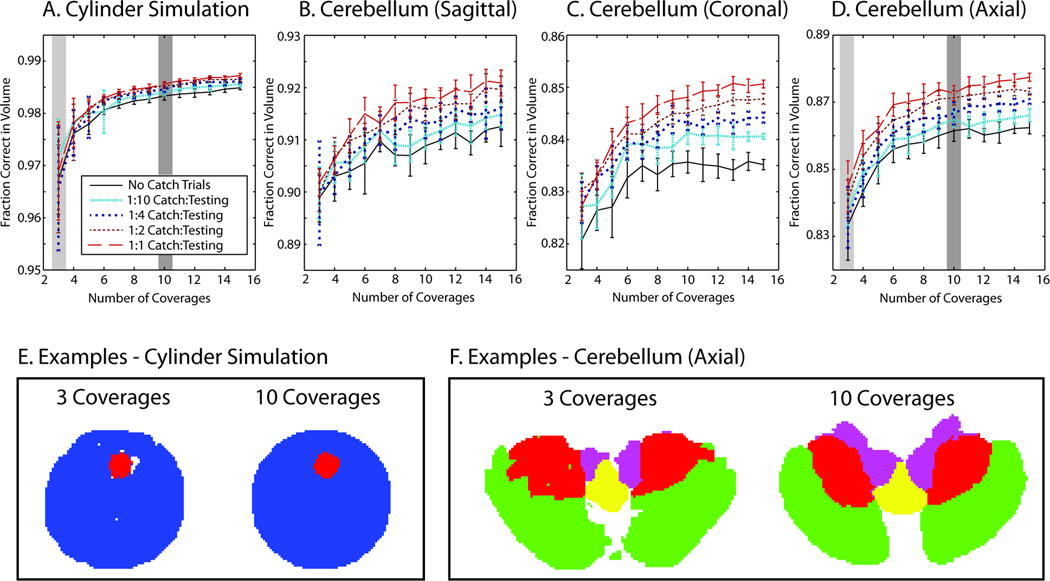
Figure 5.
Demonstration of statistical fusion. Fusion of multiple complete coverages (shown for randomized subset of the total data) resulted in improved performance and reduced variability (A–D) when compared to individual raters (Table 2 and Table 3). Representative slices illustrate the visual quality that corresponds to the highlighted coverages without training data (E corresponds to A and F corresponds to D).

