
Figure 1.
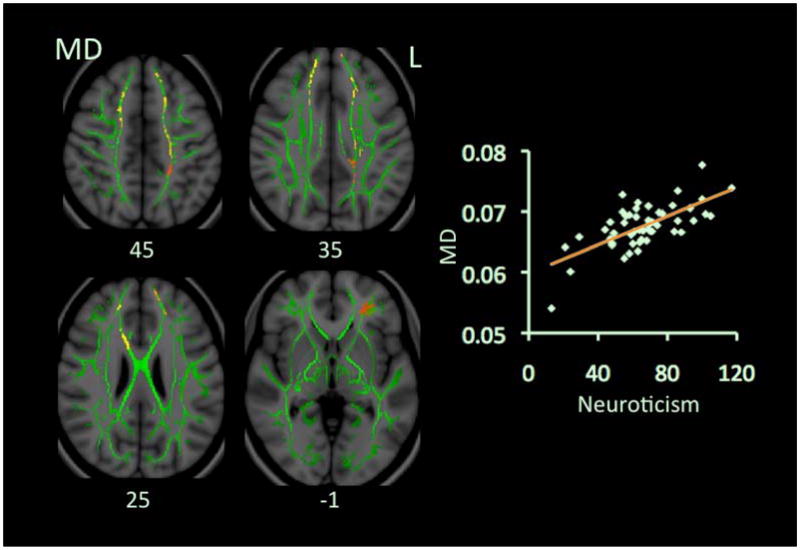
Correlations between scores on Neuroticism and values of MD. Red-Yellow color on Montreal Neurological Institute (MNI) T1 template indicates brain regions exhibiting significant correlations between scores on Neuroticism and values of MD. In this figure and all other figures in this paper, green color shows “group mean_FA_skeleton”, and the number below each brain image indicates Z coordinate in MNI space, and only clusters surviving correction for multiple comparisons of voxel-wise whole brain analysis are shown on brain images. Scatter-plots demonstrate correlations between mean MD values (y-axis) and scores on Neuroticism. Mean MD values in this figure and all other figures in this paper were calculated from all voxels from all significant clusters of each participant. Abbreviation: L: left.