Fig. 1.

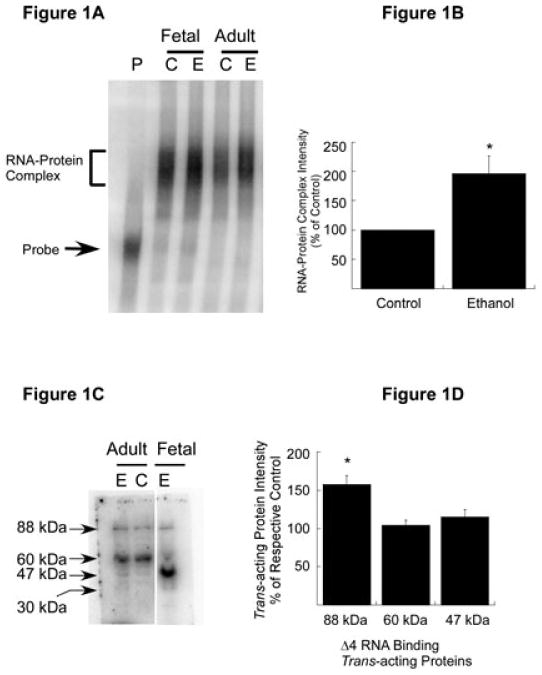
Expression of trans-acting proteins in the CC of adult mouse and effect of chronic ethanol treatment. (A) RNA gel shift analysis. [32P]-labeled Δ4 sense RNA was incubated with polysomes purified from the CC of control (C) and chronic ethanol (E)-exposed adult mice (Adult). Polysomes from control (C) and ethanol-exposed (E) FCNs (Fetal) were included as positive controls. Binding of trans-acting proteins to Δ4 RNA was detected by RNA gel mobility shift assays. A representative autoradiogram is shown here. The Δ4 RNA–protein complex (bracket) and free probe (solid arrow) are indicated on the left. (B) Effect of chronic ethanol on RNA–protein interactions. The intensity of the protein–RNA complex in A was quantitated using ImageQuantTL software. Data are expressed as a percentage of control and plotted values represent the mean + SEM of three independent experiments. Statistical analysis was performed by ANOVA and Scheffe's test (*p < 0.01). (C) Nature of Δ4 RNA-binding trans-acting protein(s) in the CC of adult mice. Polysomal proteins from the CC of control (C) and chronic ethanol-exposed (E) adult mice and ethanol-exposed (E) (50 mM, 5 days) FCNs (Fetal) were separated on SDS–polyacrylamide gel electrophoresis, allowed to refold, blotted onto nitrocellulose membrane and probed with [32P]-labeled Δ4 sense RNA. Three trans-acting proteins that interact with Δ4 RNA were detected in the CC of control and ethanol-exposed mice and four in ethanol-exposed FCNs. Solid arrows on the left indicate the apparent molecular mass of Δ4 RNA-binding trans-acting proteins. Note that gel lanes between Adult and Fetal samples have been omitted. (D) Effect of chronic ethanol on NR1 mRNA-binding trans-acting proteins. Intensities of 88, 60 and 47 kDa protein–Δ4 RNA complexes in C were quantitated using ImageQuantTL software. Data are expressed as a percentage of their respective controls and plotted values represent the mean + SEM of three independent experiments. Statistical analysis was performed by ANOVA and Scheffe's test (*p < 0.01).
