Fig. 6.

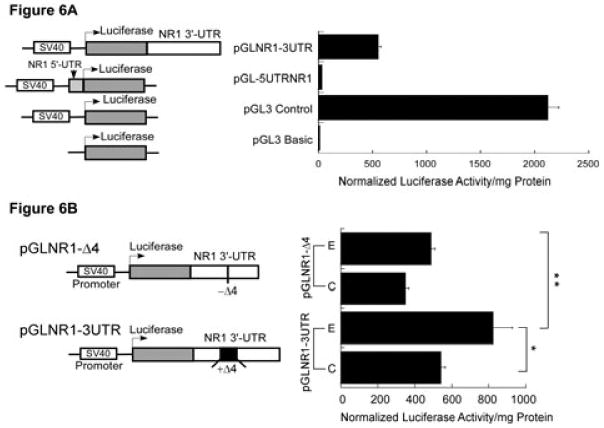
Functional analysis of the Δ4 region in the regulation of NR1 mRNA stability. (A) Effect of NR1 UTRs on luciferase enzyme activity. A schematic representation of the structure of chimeric constructs is shown on the left. Transcription (bent arrow) of the luciferase gene is driven by the constitutive SV40 promoter located upstream of the luciferase gene. The 3′-UTR of NR1 (white box) was subcloned in-frame downstream of the luciferase gene, whereas the 5′-UTR of NR1 (gray box) was subcloned in-frame upstream of the luciferase gene. These chimeric plasmids were independently transfected into FCNs and co-transfected with plasmid pRL-TK. Firefly and Renilla luciferase activities were determined by the dual-luciferase reporter assay system. Firefly luciferase activity was normalized and expressed as normalized luciferase enzyme activity per mg protein (histogram on the right). (B) Effect of the Δ4 region on expression of luciferase activity. A schematic representation of the structure of two chimeric constructs, pGLNR1-3UTR (containing the full-length NR1 3′-UTR including the Δ4 region) and pGLNR1-Δ4 (excluding the Δ4 region in the NR1 3′-UTR), is shown on the left. Control and ethanol-exposed FCNs were independently transfected with pGLNR1-3UTR and pGLNR1-Δ4, and co-transfected with pRL-TK. At 2 days after transfection, cell lysates from transfected FCNs were used to determine firefly and Renilla luciferase activities. Firefly luciferase activity was normalized as above. The histogram on the right shows the normalized firefly luciferase activity per mg soluble cellular protein. Data points represent the mean + SEM of three or more experiments. Statistical analysis was performed by ANOVA and Scheffe's test (*p<0.05, **p<0.01).
