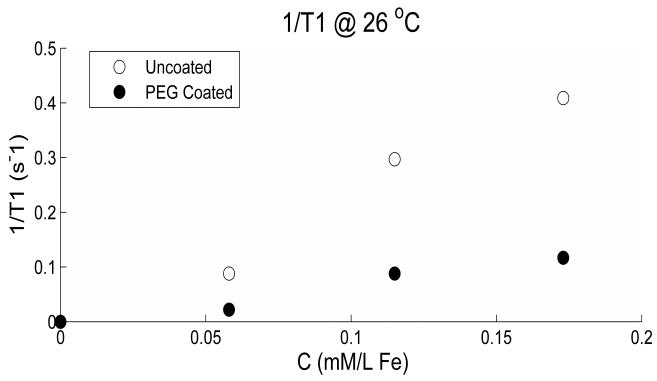
Figure 2.
1/T1 variation versus concentration is shown for both the uncoated and the coated particles. The reduction due to coating is very clear for all concentrations used. The linearity of the data is given by the r-squared values 0.976 and 0.961 for the uncoated and coated particles, respectively.

