
Figure 2.
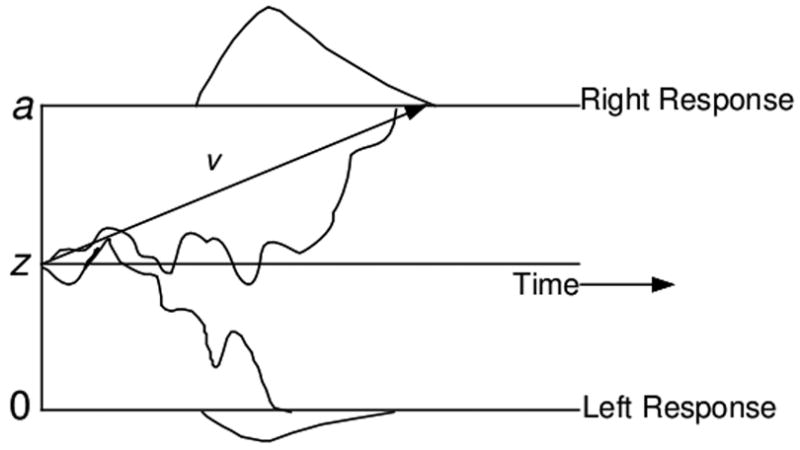
Schematic of the standard diffusion model. Noisy evidence accumulates over time from the starting point, z, to one of two boundaries, a or 0. The total response time includes the decision time plus the time taken for nondecision processes like visual encoding (i.e., ter).