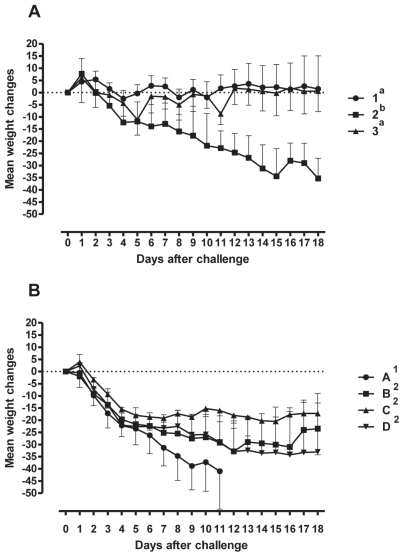
Figure 1.
Percentage weight gain of animals after the viral and bacterial challenges. The means ± SEM of the percentages are shown. Panel A — Animals (n = 8 animals/group) challenged with 1: BVDV type 1 and M. bovis; 2: BHV-1 and M. bovis; and 3: M. bovis. Panel B — Animals (n = 6 animals/group) challenged with A: BHV-1 and M. bovis by the intranasal route; B: BHV-1 (intranasal) and M. bovis (intratracheal) routes; C: Same as B but 10-fold less M. bovis; D: Same as B but 100 fold-less M. bovis. The changes in weight in groups with different superscripts are significantly different.

