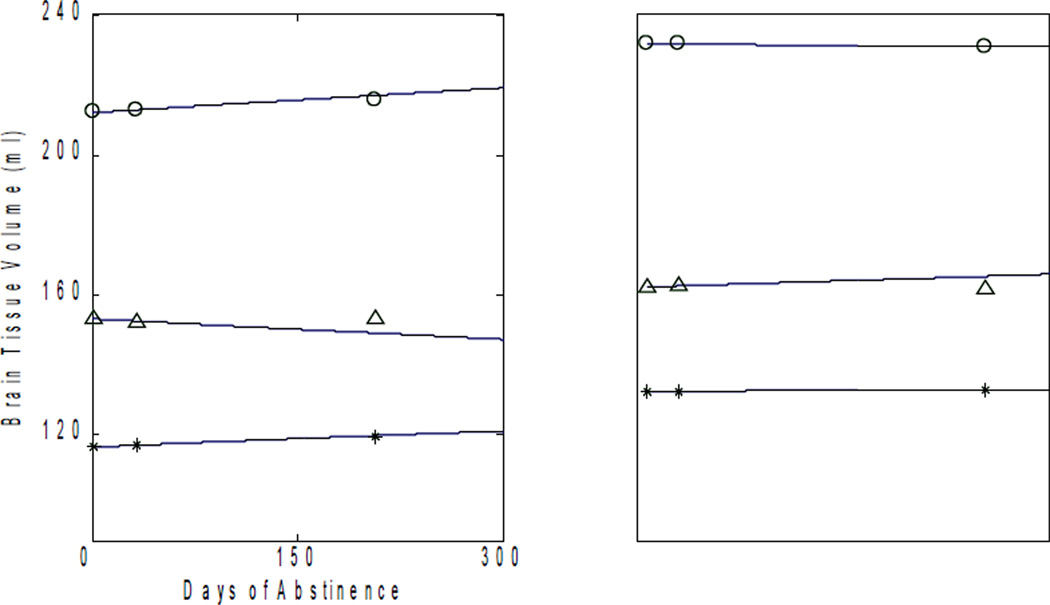
Figure 2.
Plots of frontal, parietal and temporal gray matter volumes against days of abstinence for 8 representative participants. The curves represent our formula’s trajectory of volume change with time, using TP1 and TP2 data as input. The circular, star and triangular marks represent the observed data for frontal, parietal and temporal gray matter, respectively.

