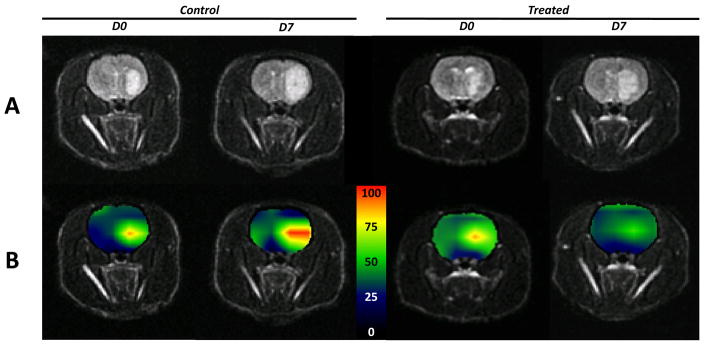
Figure 3.
(A) Axial T2-weighted images and (B) corresponding heatmaps of the (Lactate/Pyruvate)NORMALIZED ratios derived from HP 13C MRSI datasets of one control (left) and one Everolimus treated (right) animal. For each animal, the left column corresponds to data acquired prior to initiation of treatment (D0), the right column to data obtained at D7. Everolimus treatment induces a decrease of the (Lactate/Pyruvate)NORMALIZED ratio in the tumor region for the treated animal, whereas an increase of this ratio can be seen in the control animal.

