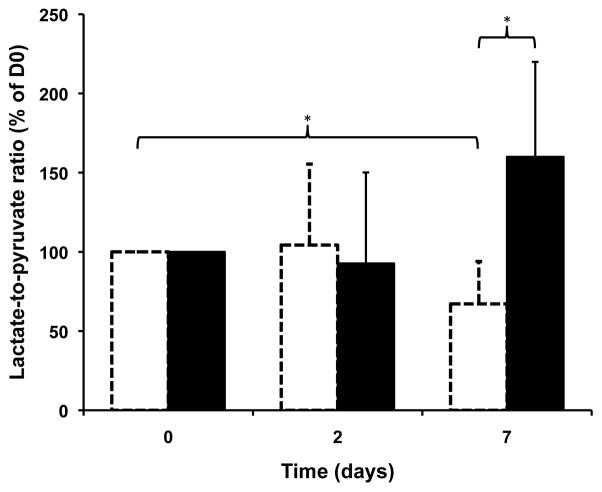
Figure 4.
Histogram of the average (Lactate/Pyruvate)NORMALIZED ratios at D0, D2 and D7 for control (black) and treated (white, dotted) groups. The average ratios were significantly different between control and treated animals at D7, and a significant decrease in this ratio was measured between D0 and D7 for the treated group. *p=0.05

